Posted
Welcome back, Class! This is ThreatConnect 101 for CTI analysts featuring me…a former analyst and all-around nerd. If you haven’t seen the first post in this series, I highly recommend checking that out before diving into this one. Check out ThreatConnect Query Language (TQL) for People Who Don’t Code. Part 1 lays the foundation that we’ll build upon in this post, go ahead and take a look. I’ll wait.

All done? Great! Welcome back again! In Part 2 of this series, we will dive into creating dashboards in ThreatConnect. Specifically, we’ll talk about creating an analyst Dashboard and what items you may want to include on a Dashboard built specifically for your team’s TI analysts. Dashboards can be a powerful tool for elevating information to yourself, your colleagues, and management who may have access to the ThreatConnect Platform.
The default Dashboard for an account is the first thing someone sees when they log into ThreatConnect. As they say, we only have one chance to make a first impression, and naturally, we want that first impression to be a good one. Before we jump into building your own Dashboard, let’s talk about all the things you can do with Dashboards.
I mentioned that Dashboards can be a powerful tool, and that’s easy for me to say, but what exactly makes Dashboards powerful? Dashboards enable users to create a customized view of information of interest from ThreatConnect. Users can add tables, charts, and widgets that give their colleagues (and themselves) a quick and easy view to understand what matters and what’s new at that moment. For example, an analyst may want to make a Dashboard tracking a specific Threat Actor Group or Intrusion Set like APT31. Alternatively, they may want to make a Dashboard looking for new information related to a specific set of ATT&CK techniques or vulnerabilities.
For now, let’s jump into the meat of this post. We’re going to start by walking through the steps for building a Dashboard, and then we’ll talk about some of the cards you might want to add to a Dashboard and how you can customize those cards to be most helpful for you and your team.
STEP 1: Open ThreatConnect
In order to really dive into this, we first need to log into ThreatConnect.

Once you’re logged in, you should see a screen that looks like this:
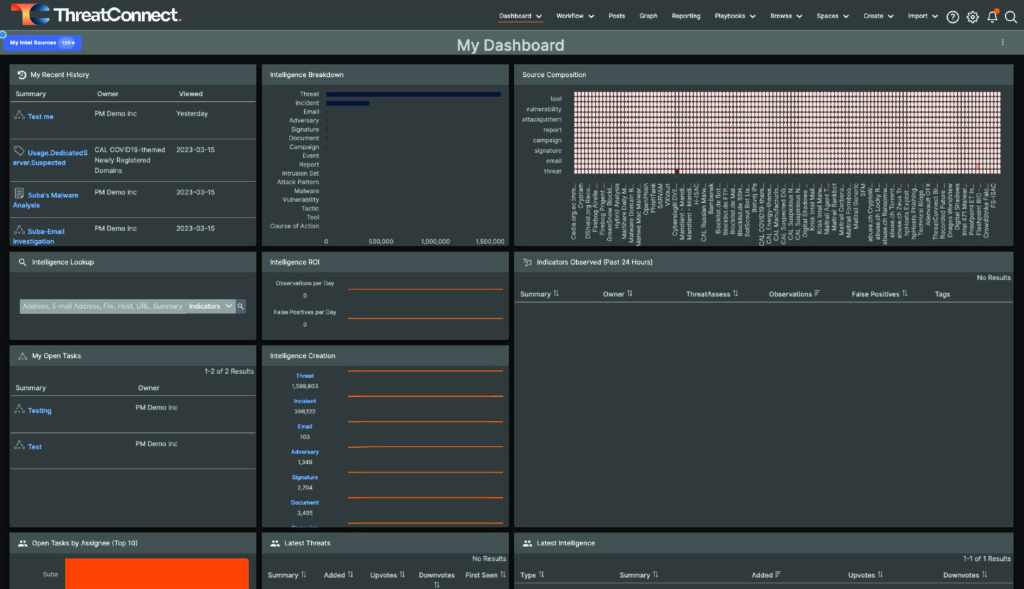
Out of the Box Default Dashboard in ThreatConnect
If you look at the top of the page toward the middle of the top, you’ll see “Dashboard” as the leftmost option, which brings us to…..
STEP 2: Create a New Dashboard
Use your cursor to hover over “Dashboard” at the top of the page.
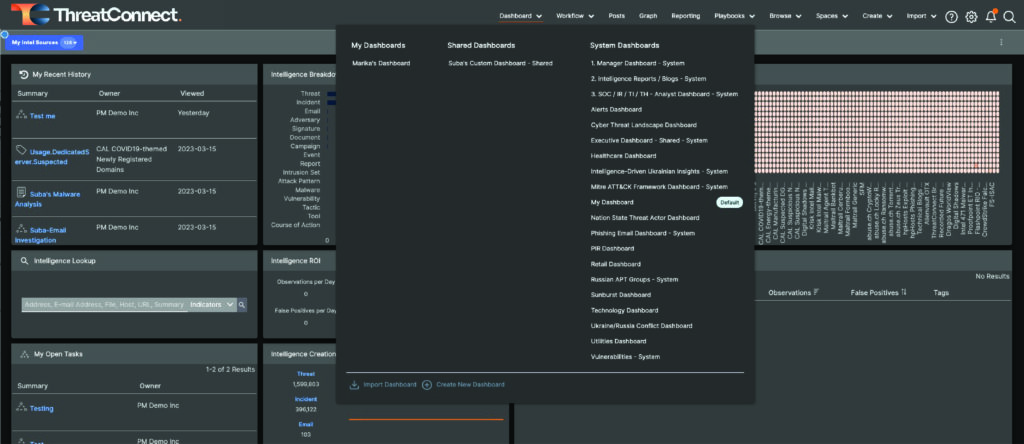
Expanded Dashboard Menu
Hovering will expand the Dashboard menu like what you see in the screenshot above. Your Dashboard options may vary depending on your instance of ThreatConnect.
Next, take a look at the bottom left of the expanded menu, and you’ll see two options: “Import Dashboard” and “Create New Dashboard.” For this exercise, click “Create New Dashboard.”
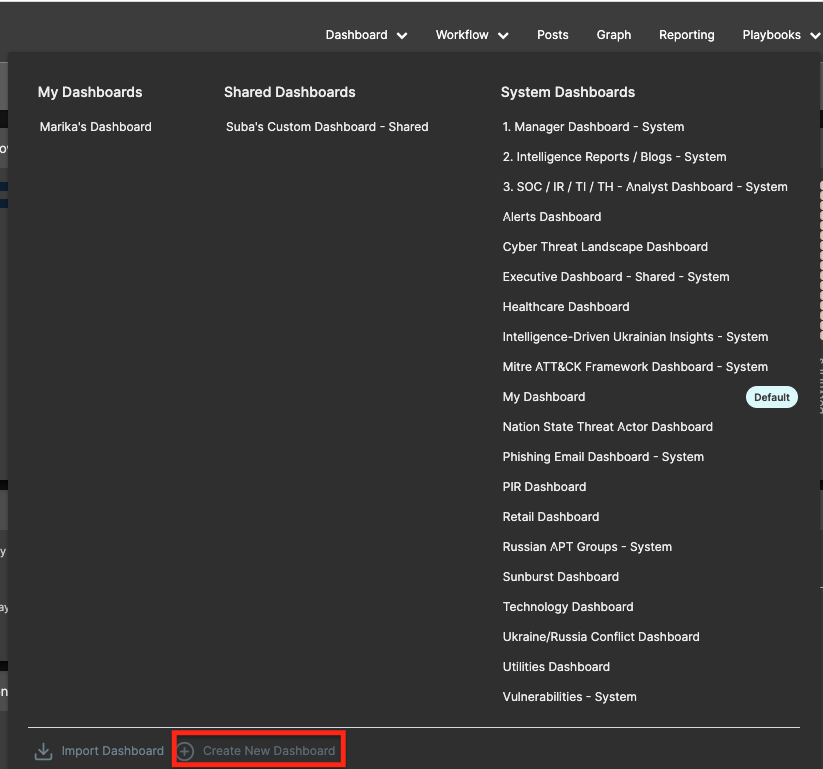
Expanded Dashboard Menu showing “Create New Dashboard” Button
Upon clicking “Create New Dashboard,” a dialogue that looks like the one in the screenshot below will appear.
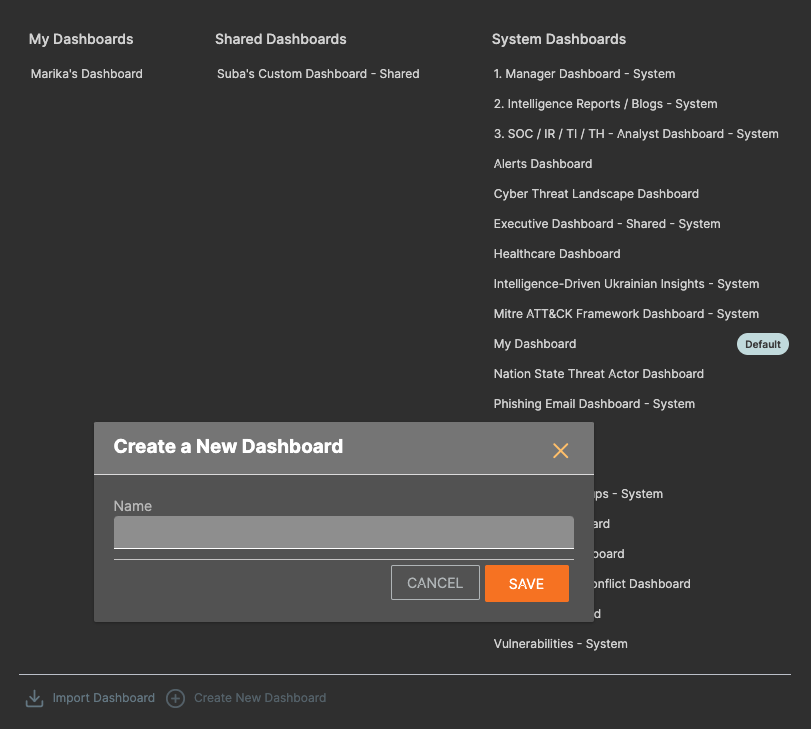
Create a New Dashboard Dialogue Box
Give your new Dashboard a name and click Save.
Once Saved, you’ll see the following page.
New, empty Dashboard
STEP 3: Add Cards to the New Dashboard
If you click the “Add Your First Card” box, a drawer on the left of the screen will open and show the various types of cards you can add. You can choose from a Widget, Metric, or Query.
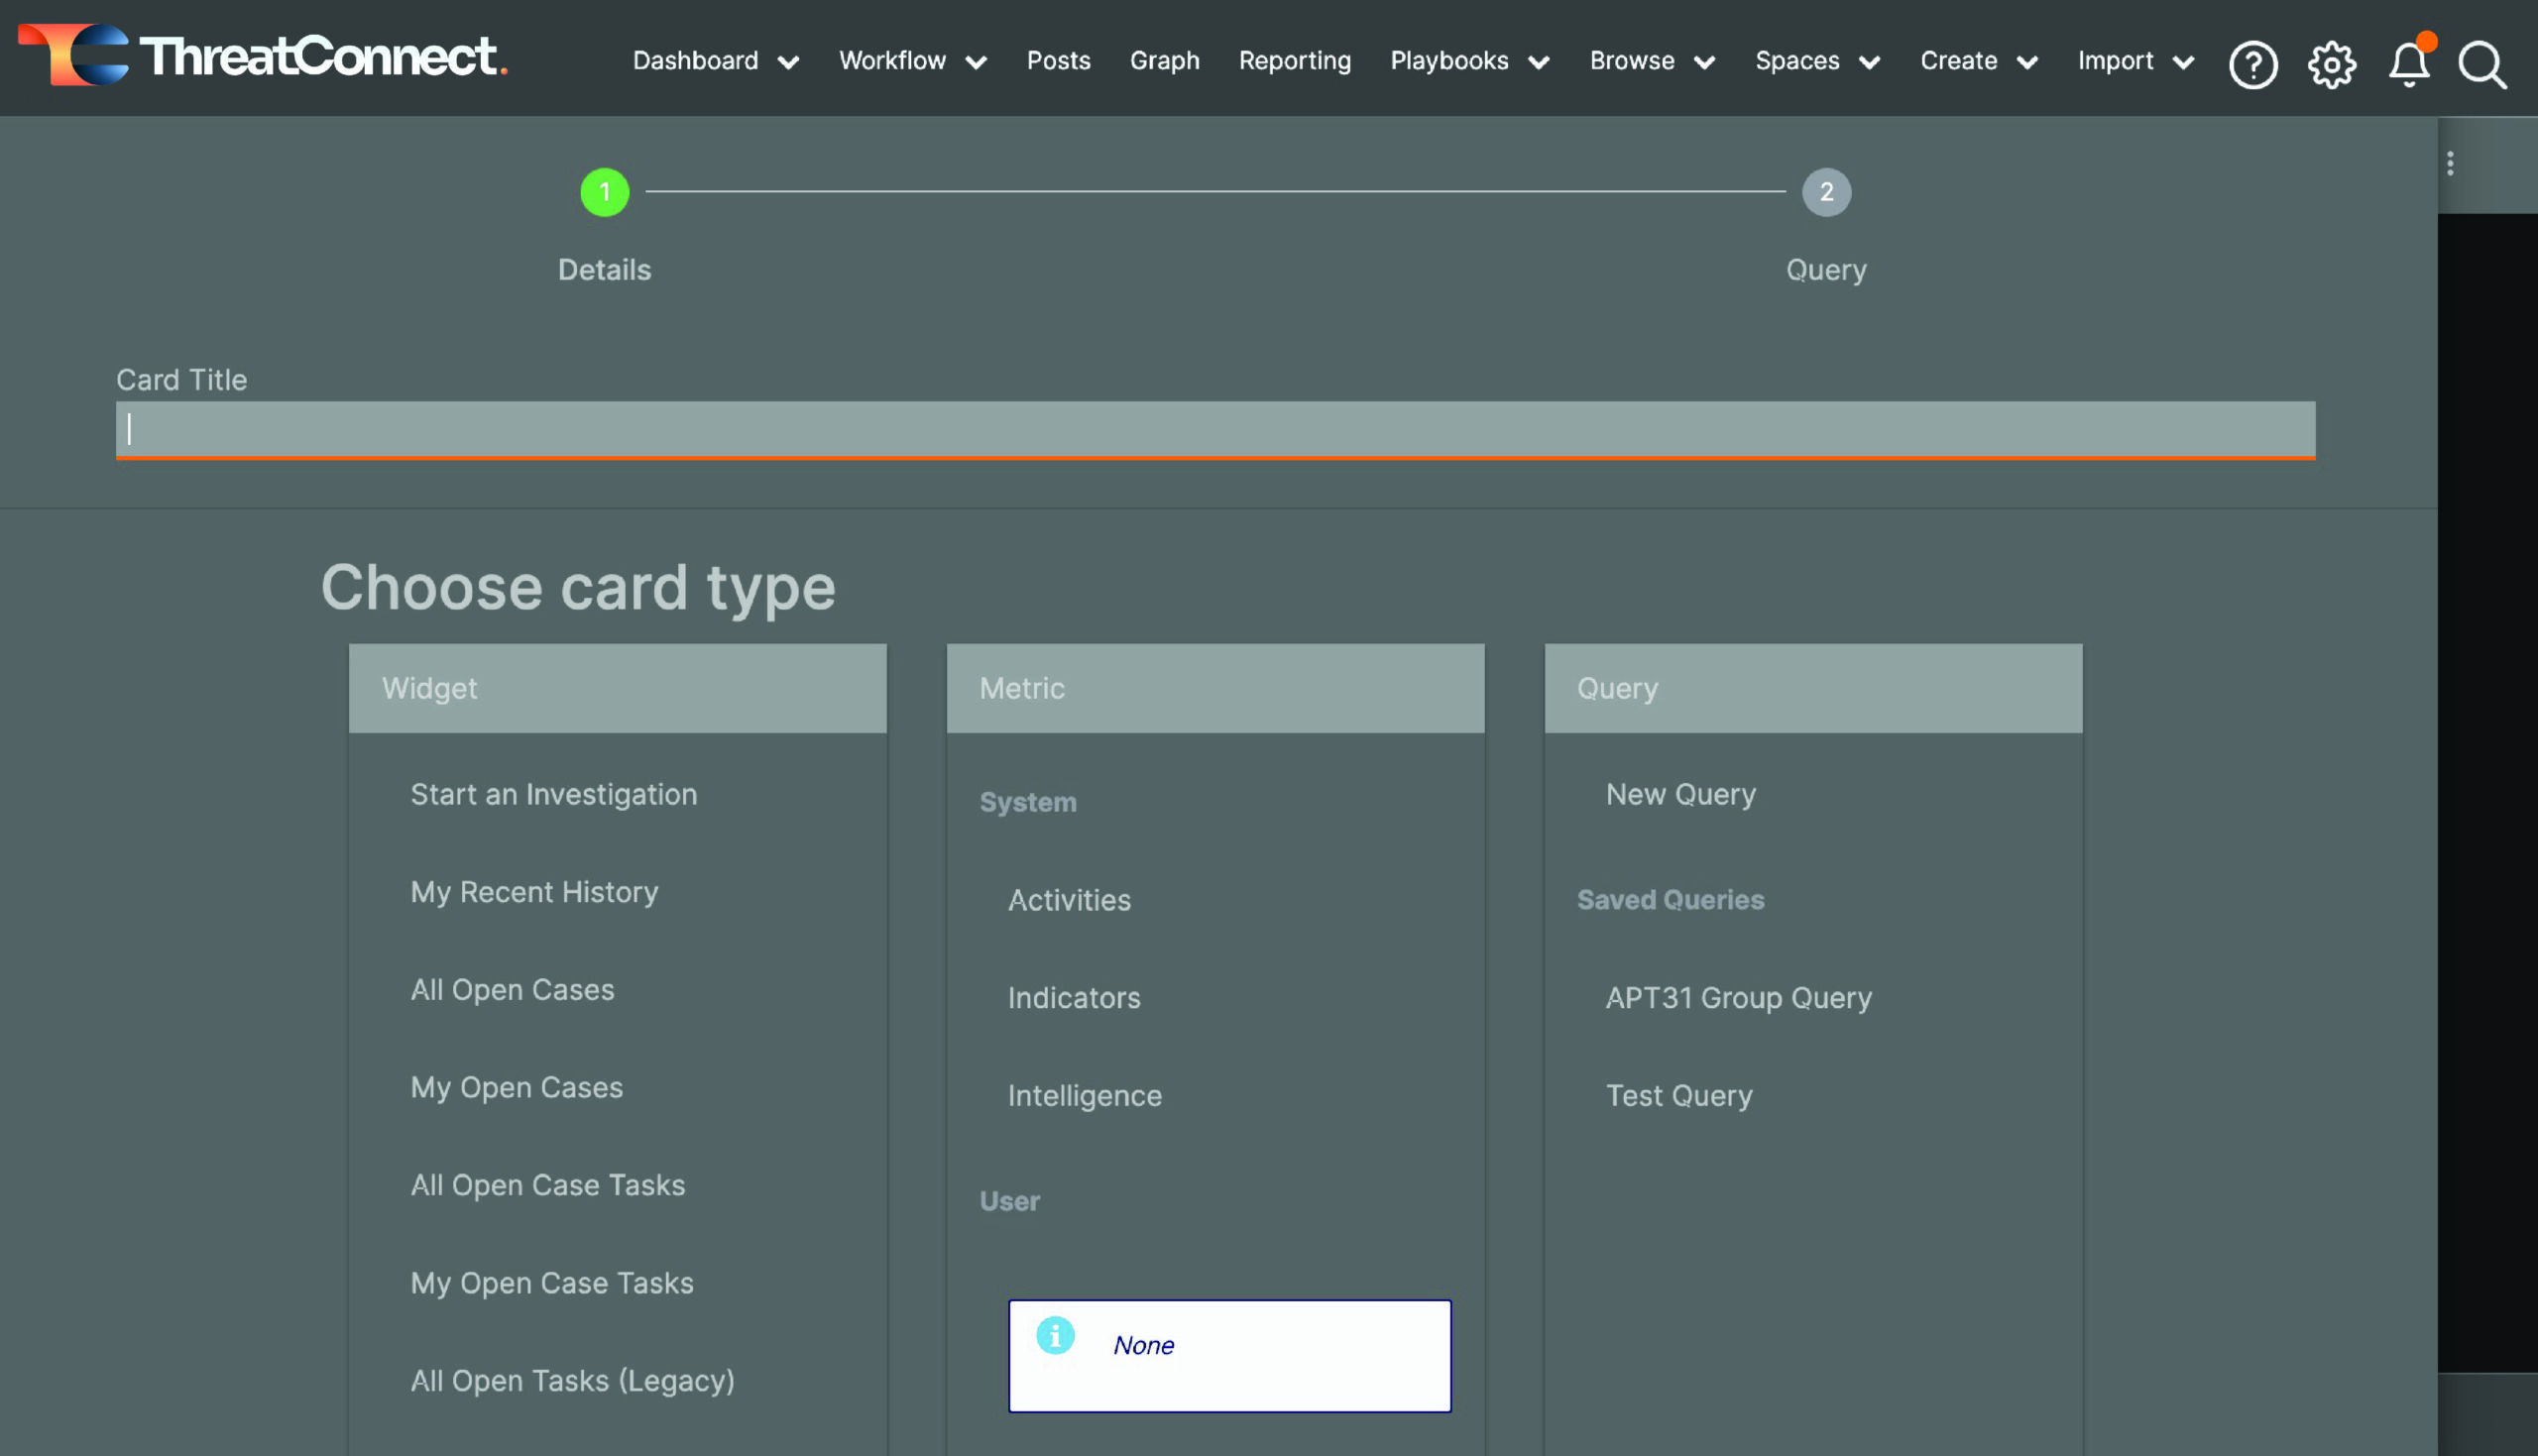
Dashboard Card options
I like to start my Analyst Dashboards by including the “My Recent History” widget because sometimes I get distracted and…

…forget what I was doing.
For this card, I’m just going to select “My Recent History,” and that will automatically add the card to my dashboard.
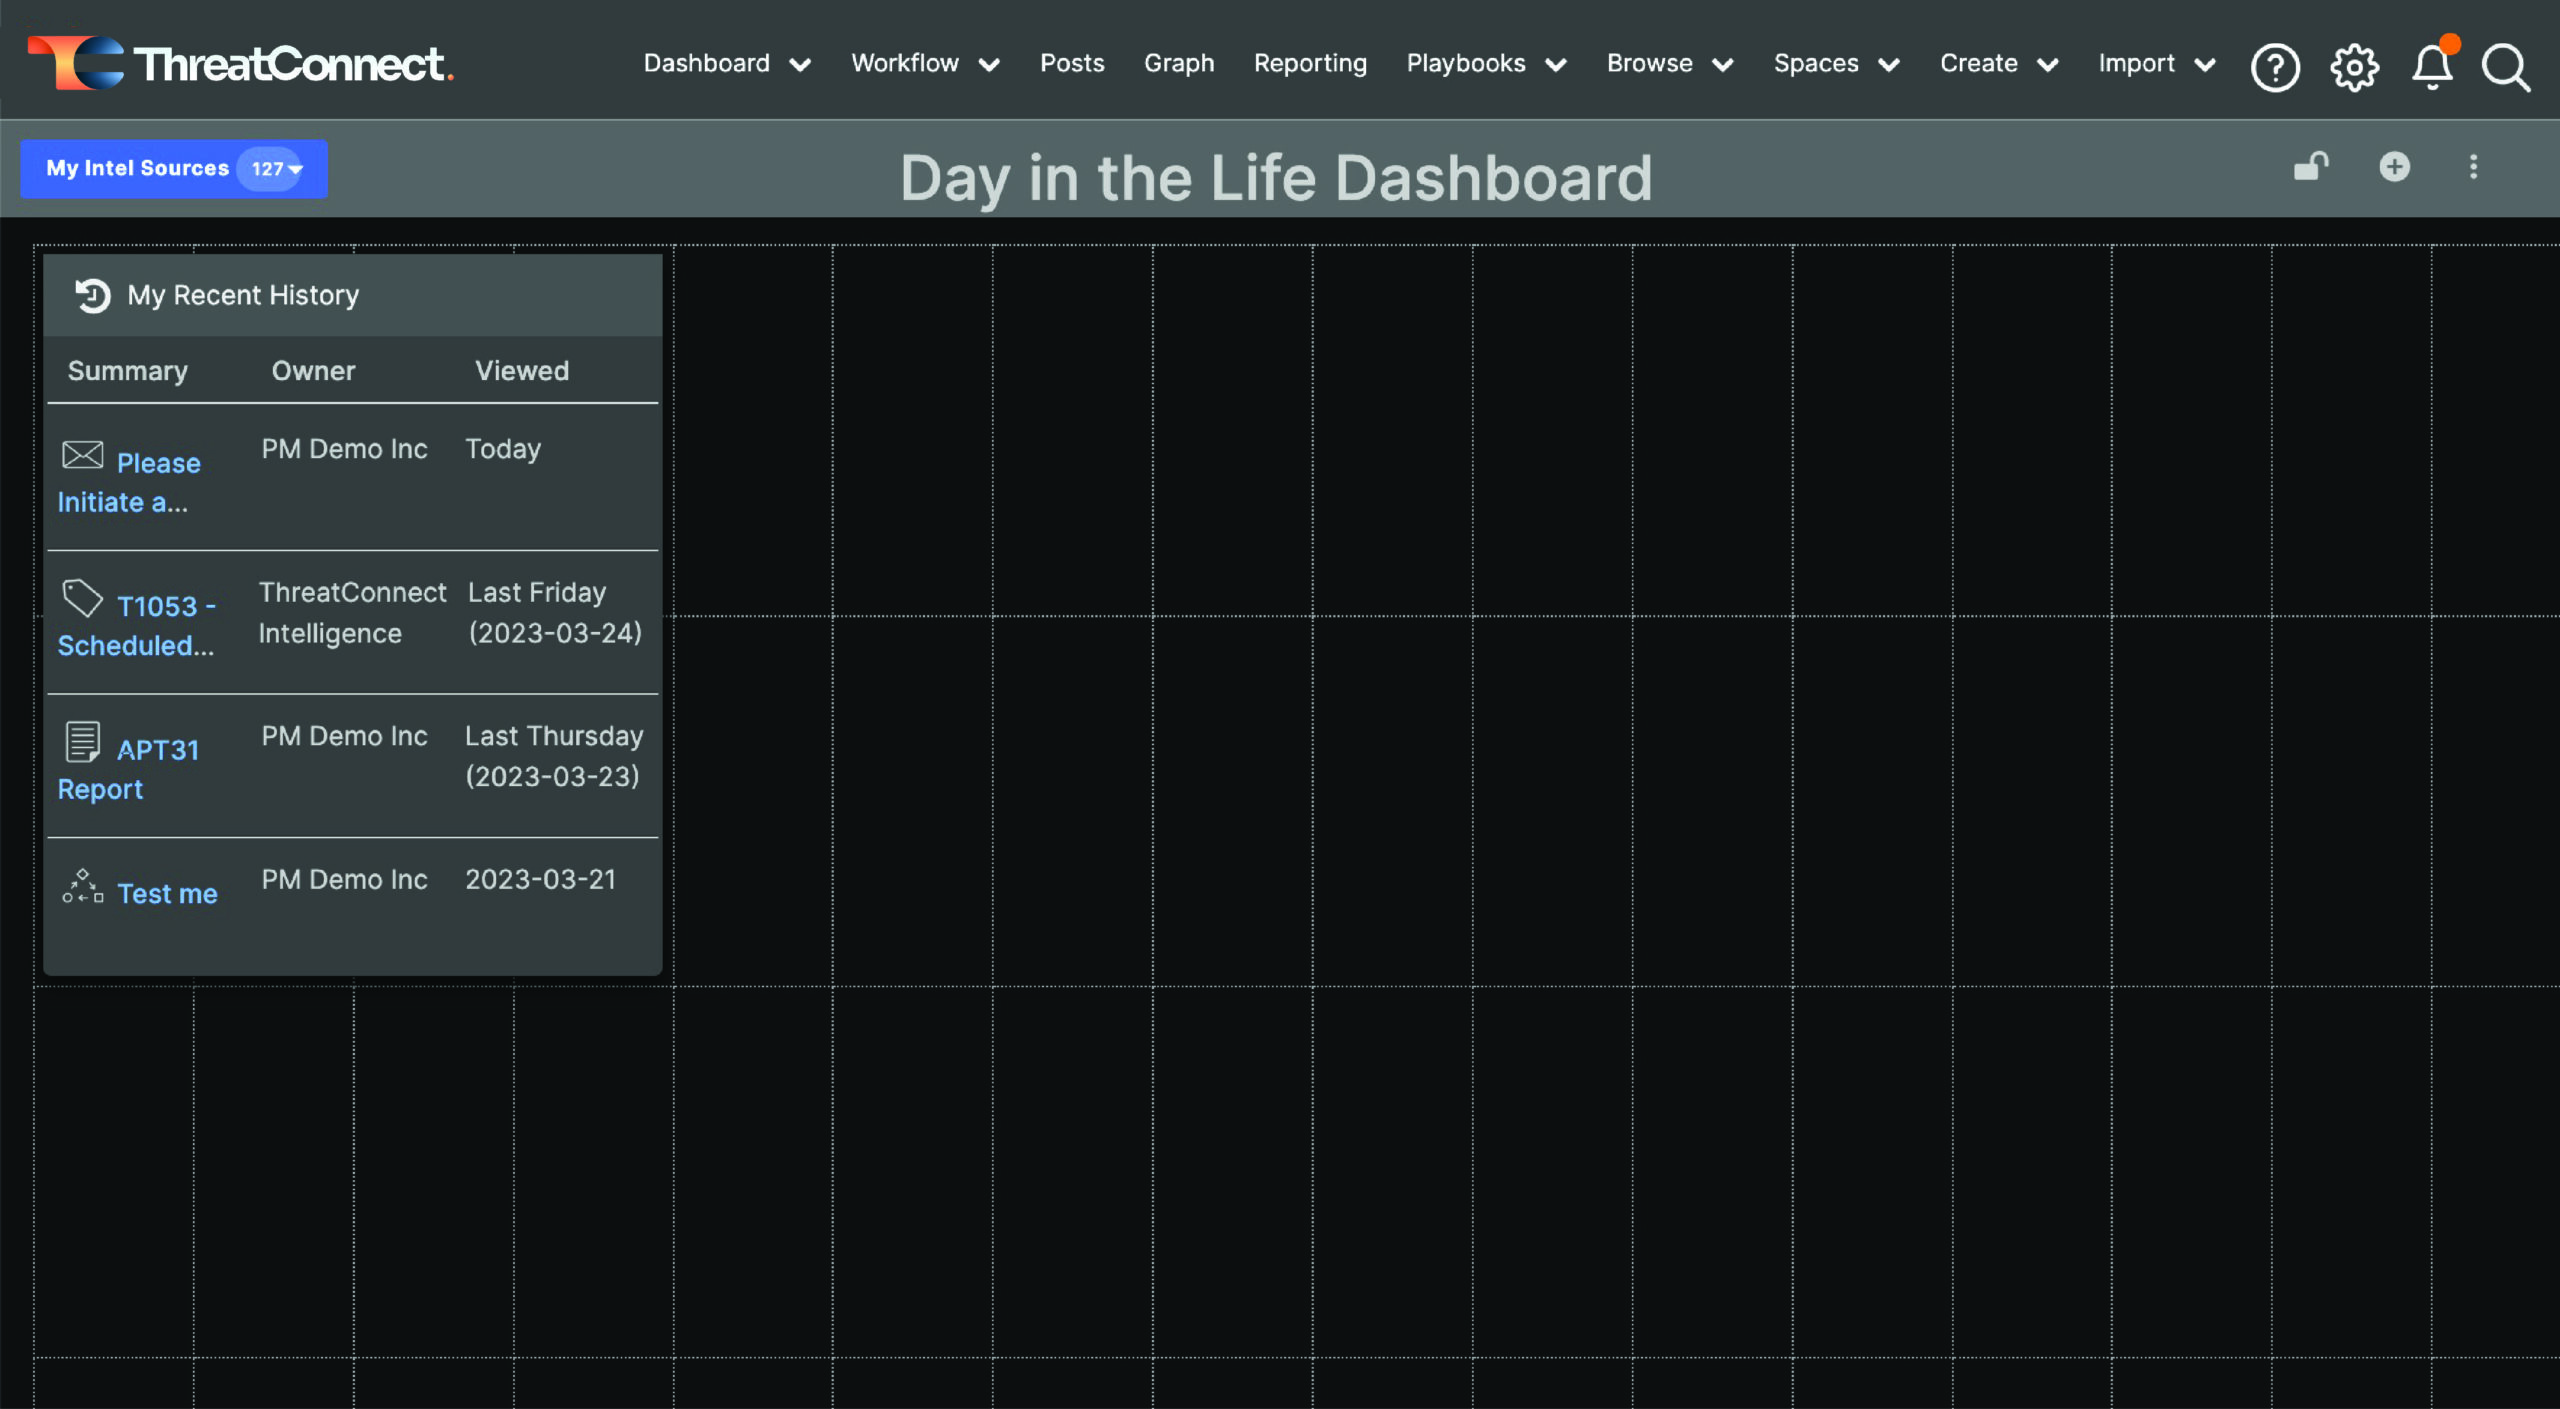
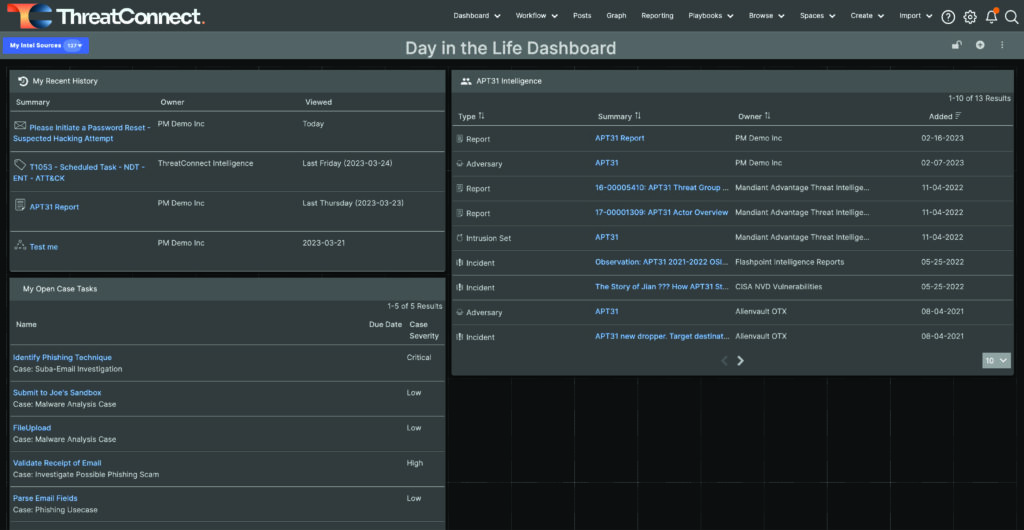
Dashboard showing My Recent History
From there, I can resize the card however I want.
For the next card, I’m going to add a Query.
In order to do that, I click on the + at the top right of my dashboard. This will open the drawer on the left side of the screen again so that you can add additional cards.
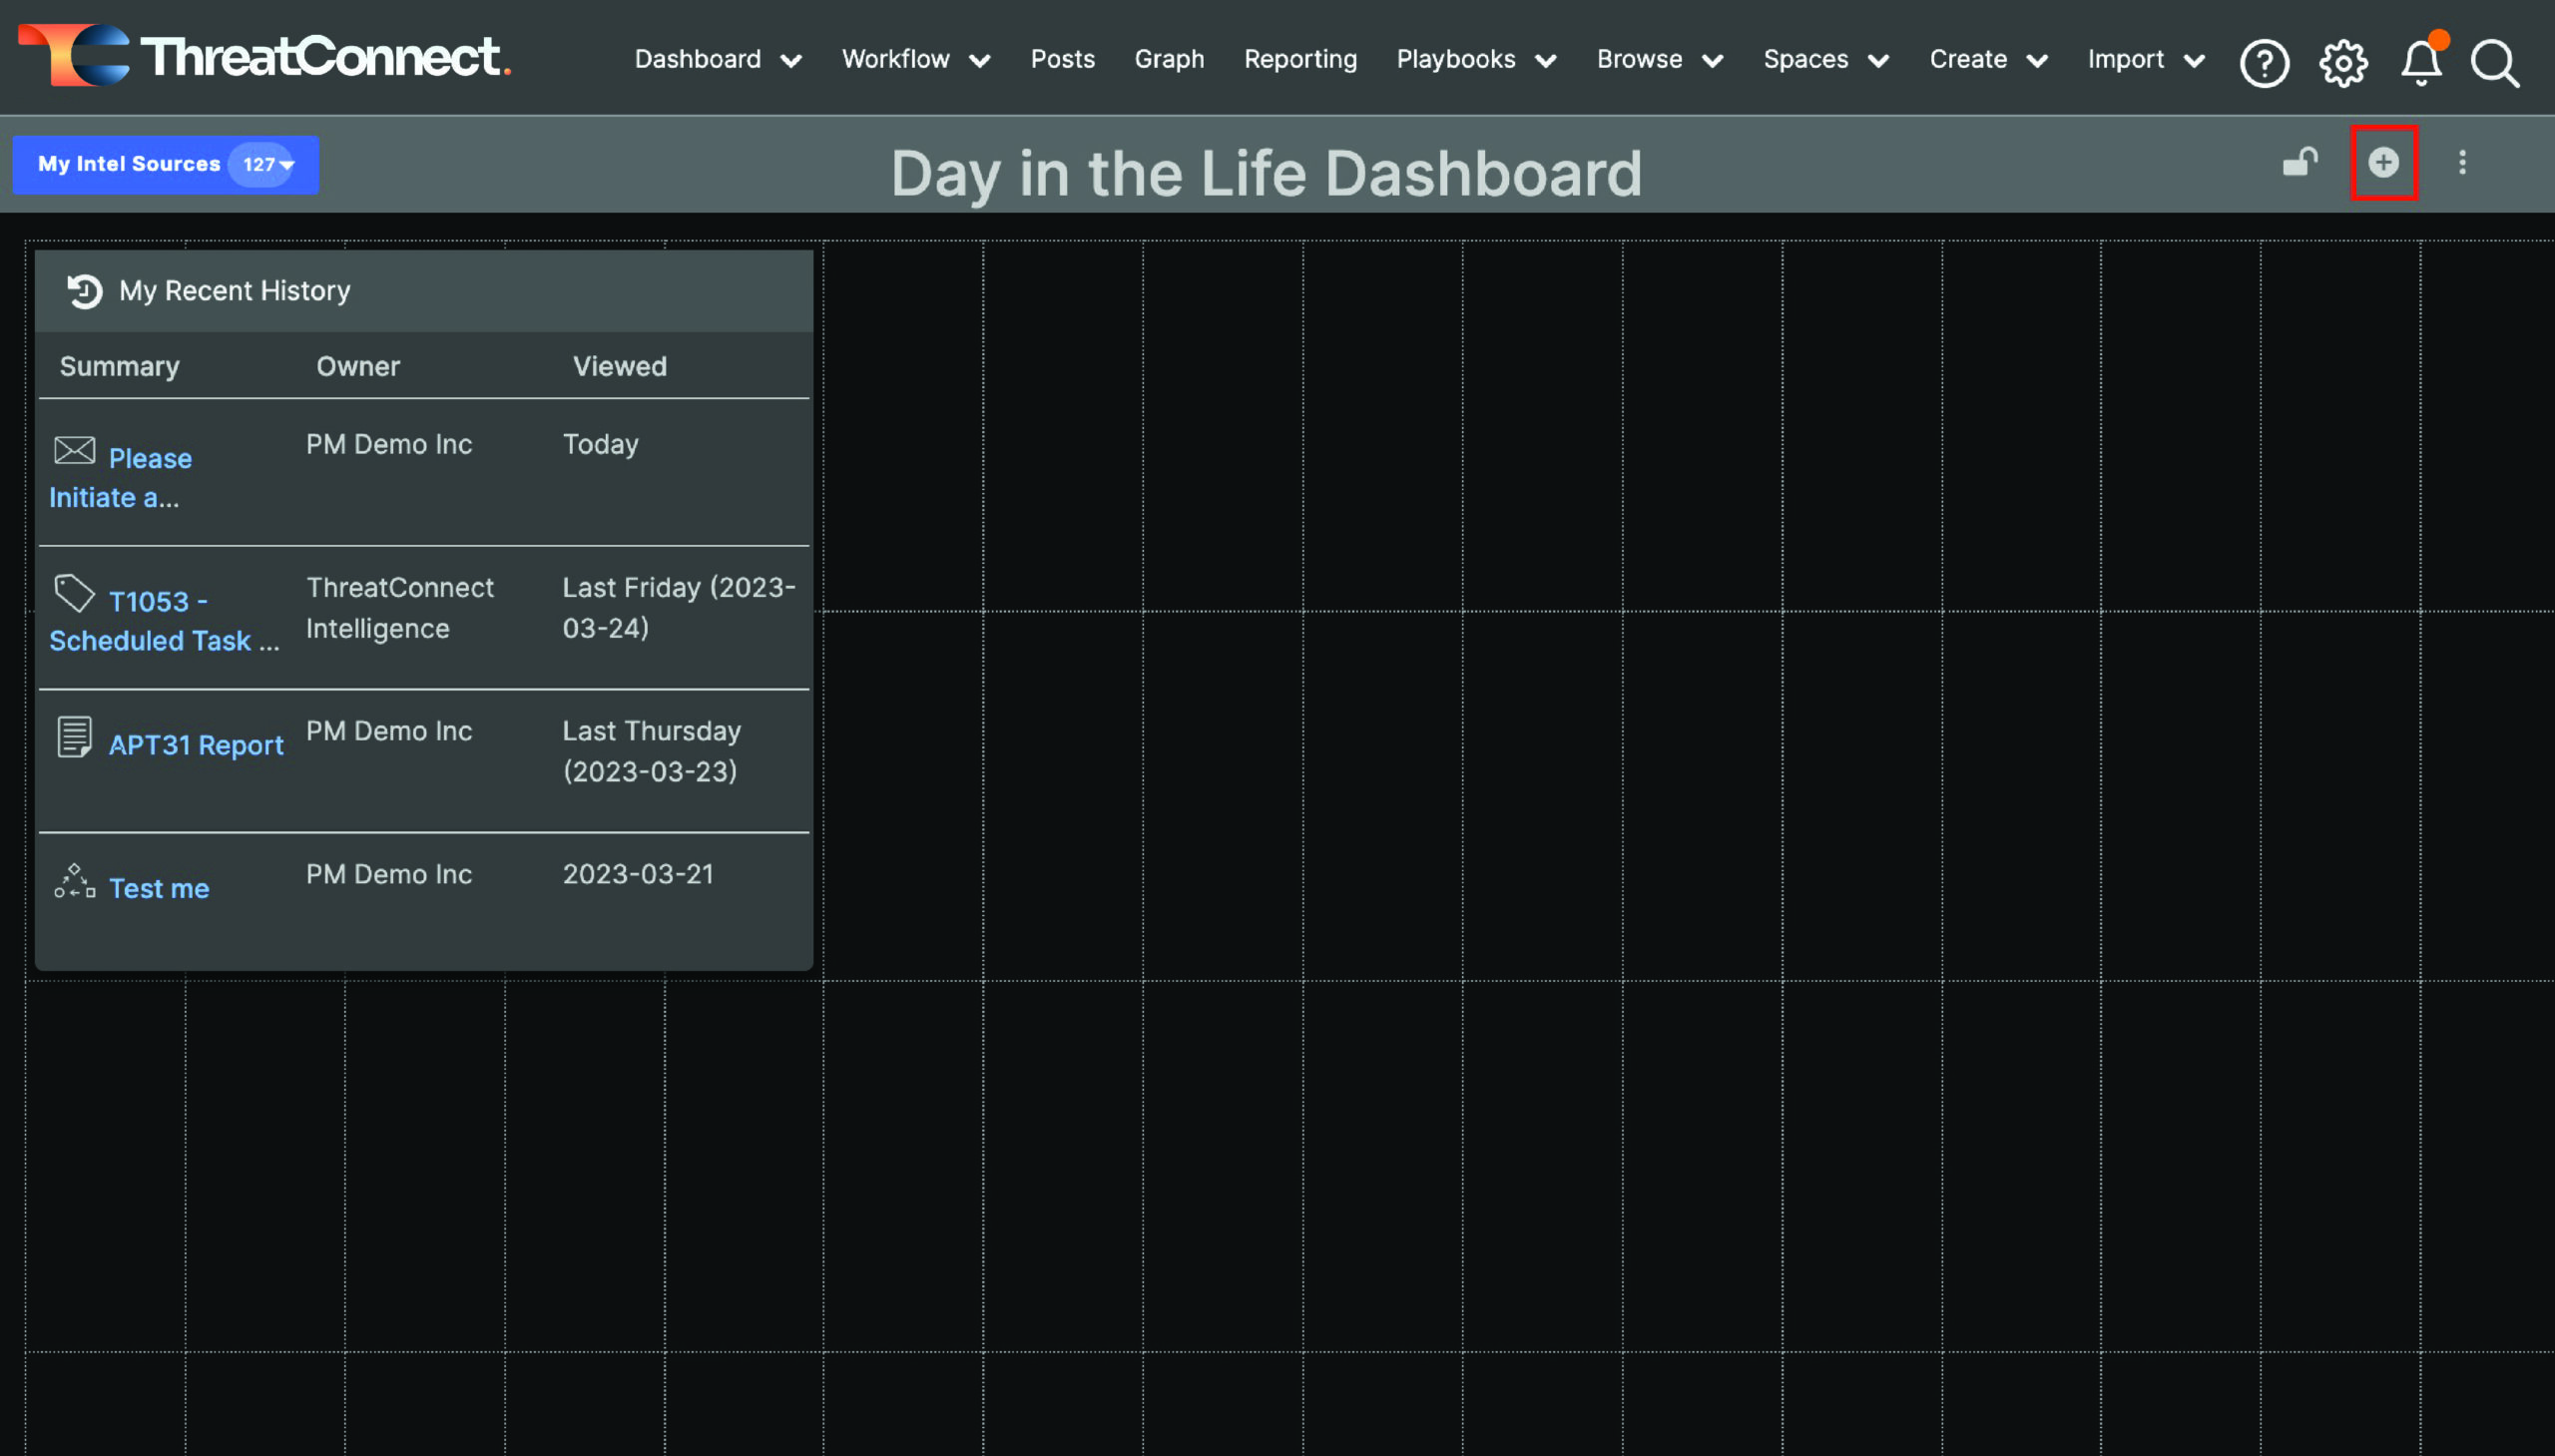
Click the + at the top right
Give the new card a name. In my case, I’m going to use my APT31 Group query to populate my new card, so I’m calling my card “APT31 Intelligence”.
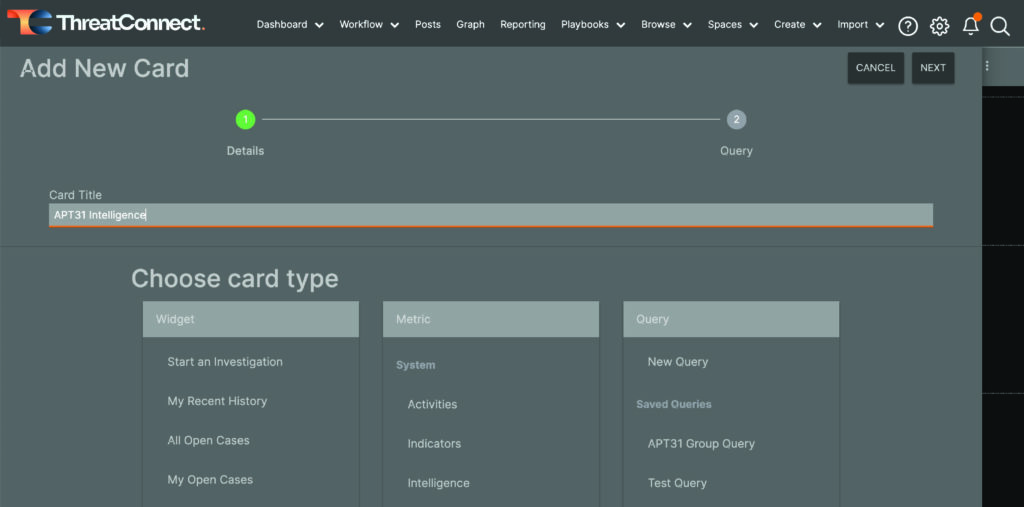
Configure the new card
Then, select the Saved Query you want to use to populate the new card or craft a new query by selecting “New Query.” As you may remember, I’m not fluent in TQL. I used the steps shown in my previous blog post to create my APT31 Group query to create a Dashboard card and keep up with new information coming in related to that intrusion set.
After selecting a query, you will see some additional options, as shown in the screenshot below. Here you can choose specific intel sources to include in your new card, or you can choose to inherit the owner selections from “My Intel Sources,” which may change depending on what you’re looking for at a given time. For cards like this one, I usually select all of my Intel Sources and Communities because I want to see any new information that comes in that matches my query.
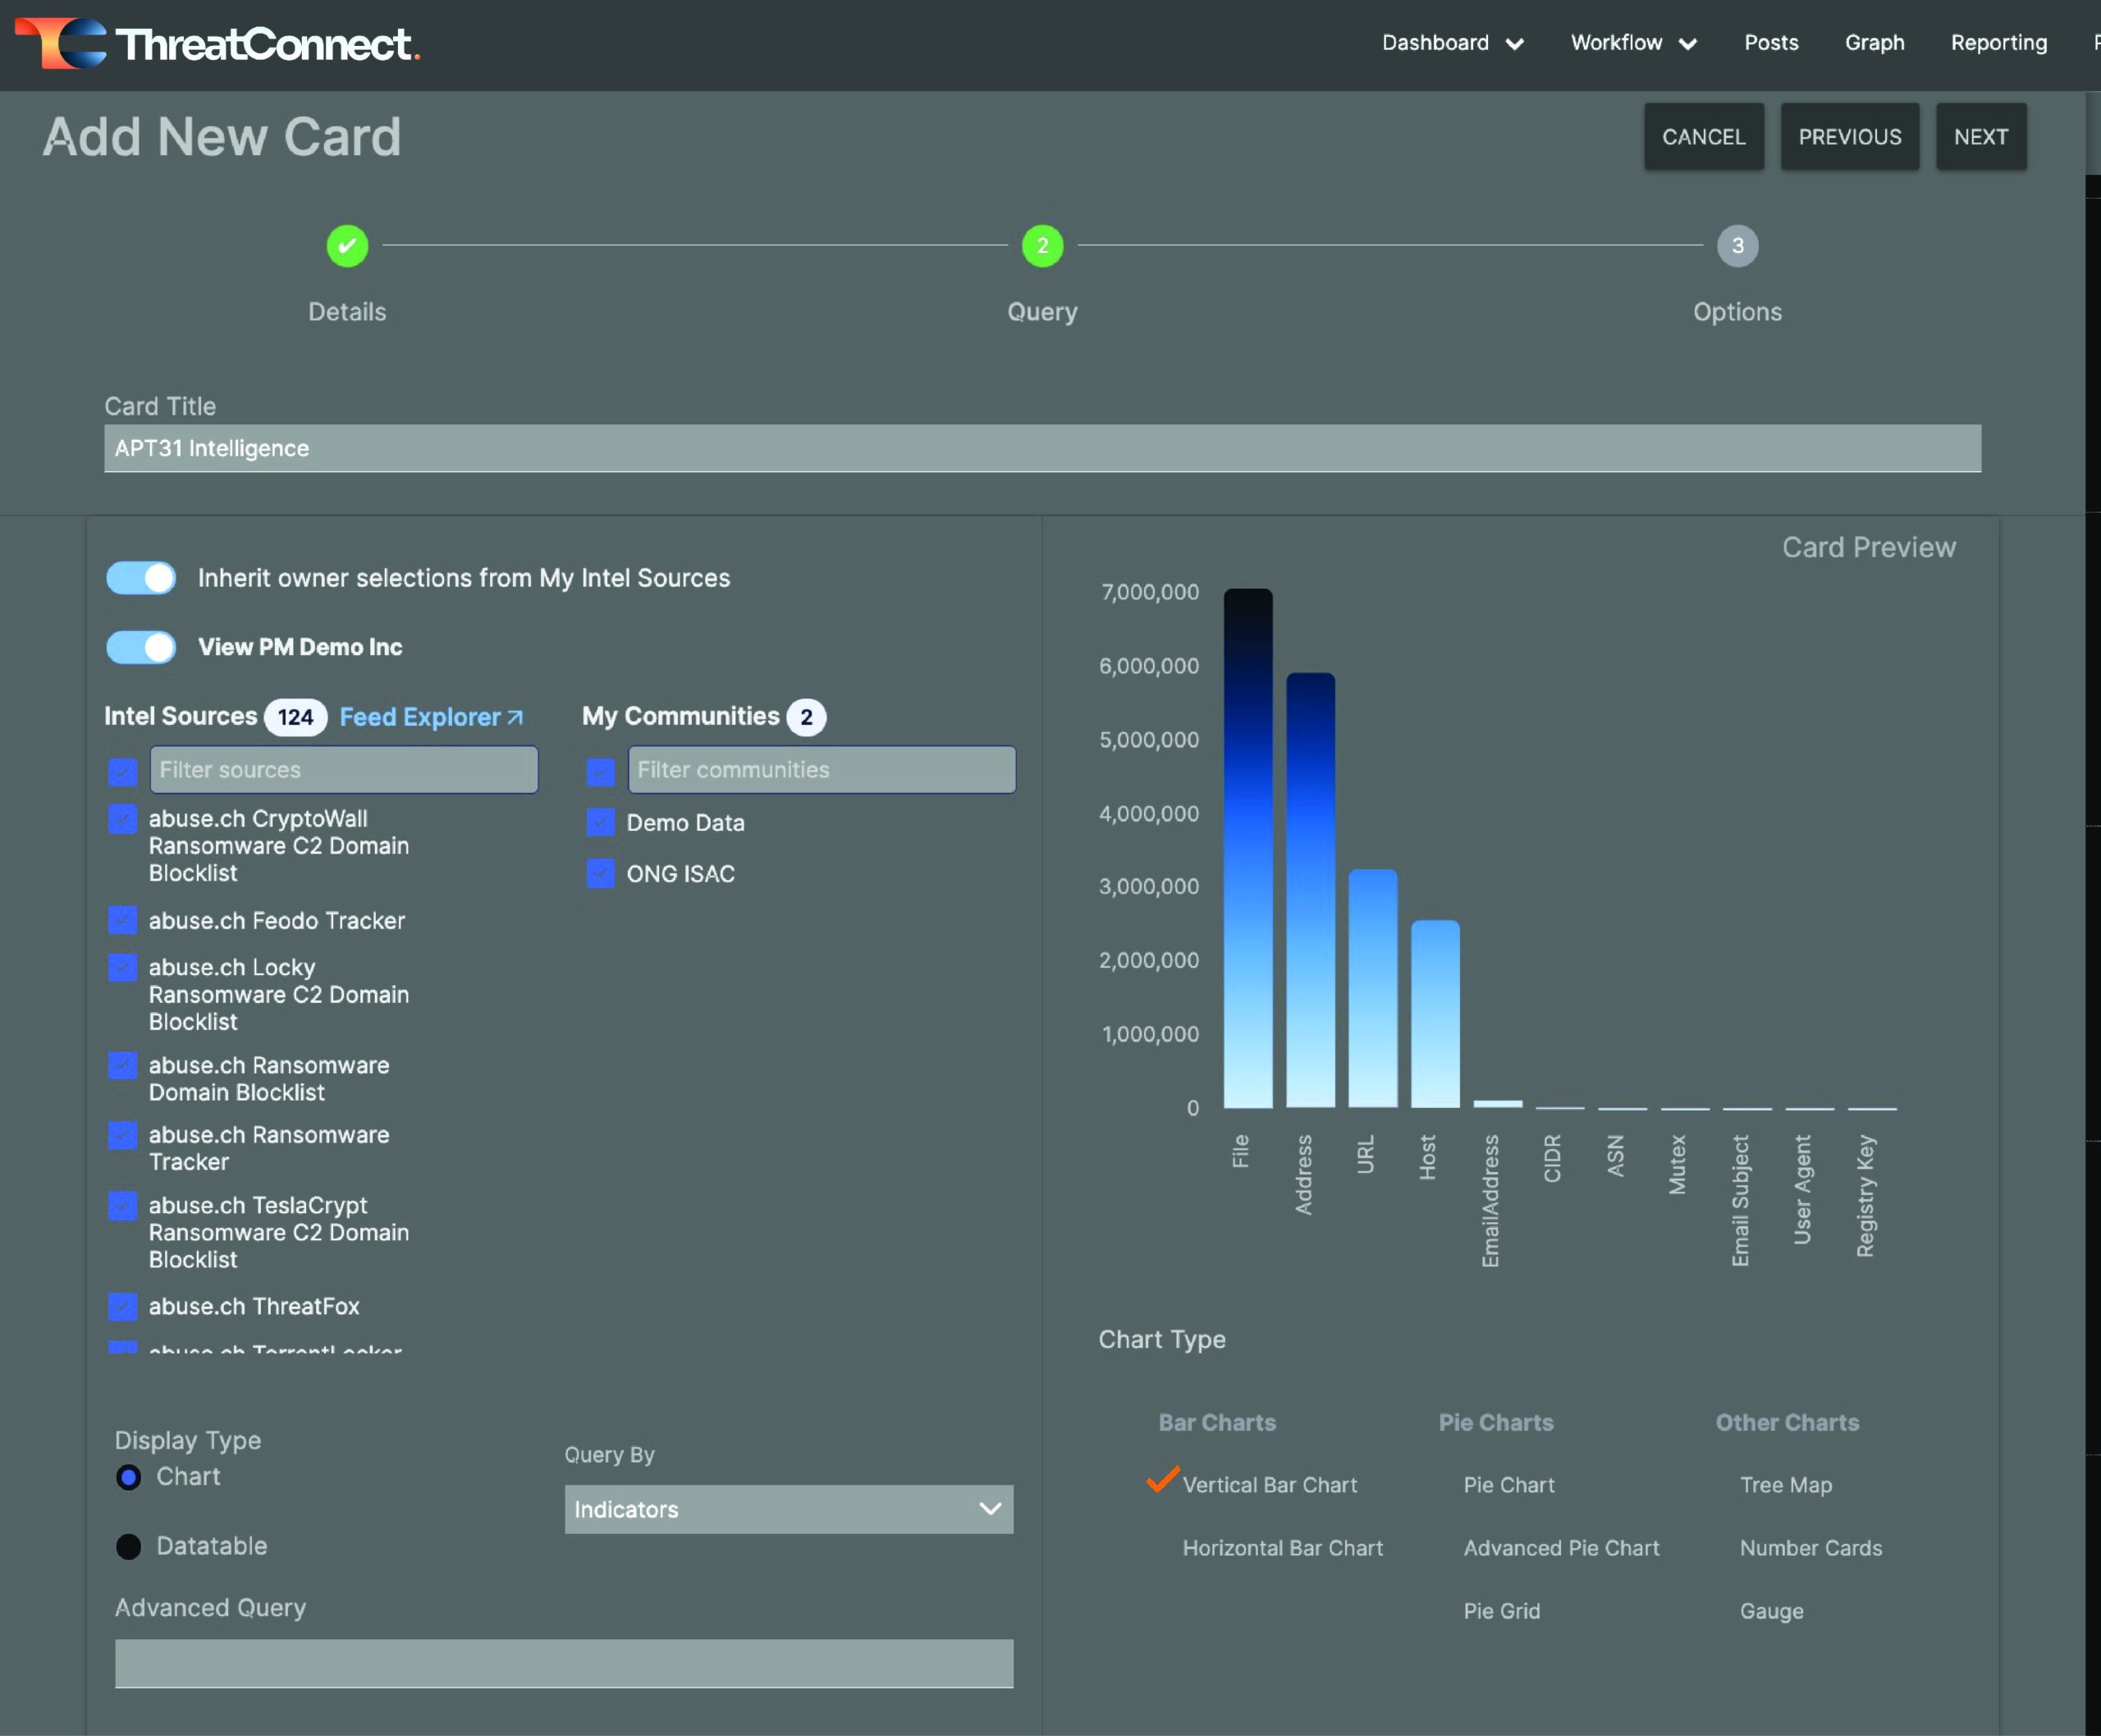
Configuration options for the query card
Also, I want this card to be a data table, not a chart, so I select “Datatable” under Display Type. This will shift the display to a table so that I can choose the columns that I want to be displayed.
You can also choose whether your query is intended to query for Groups or Indicators so that it presents the information you want.
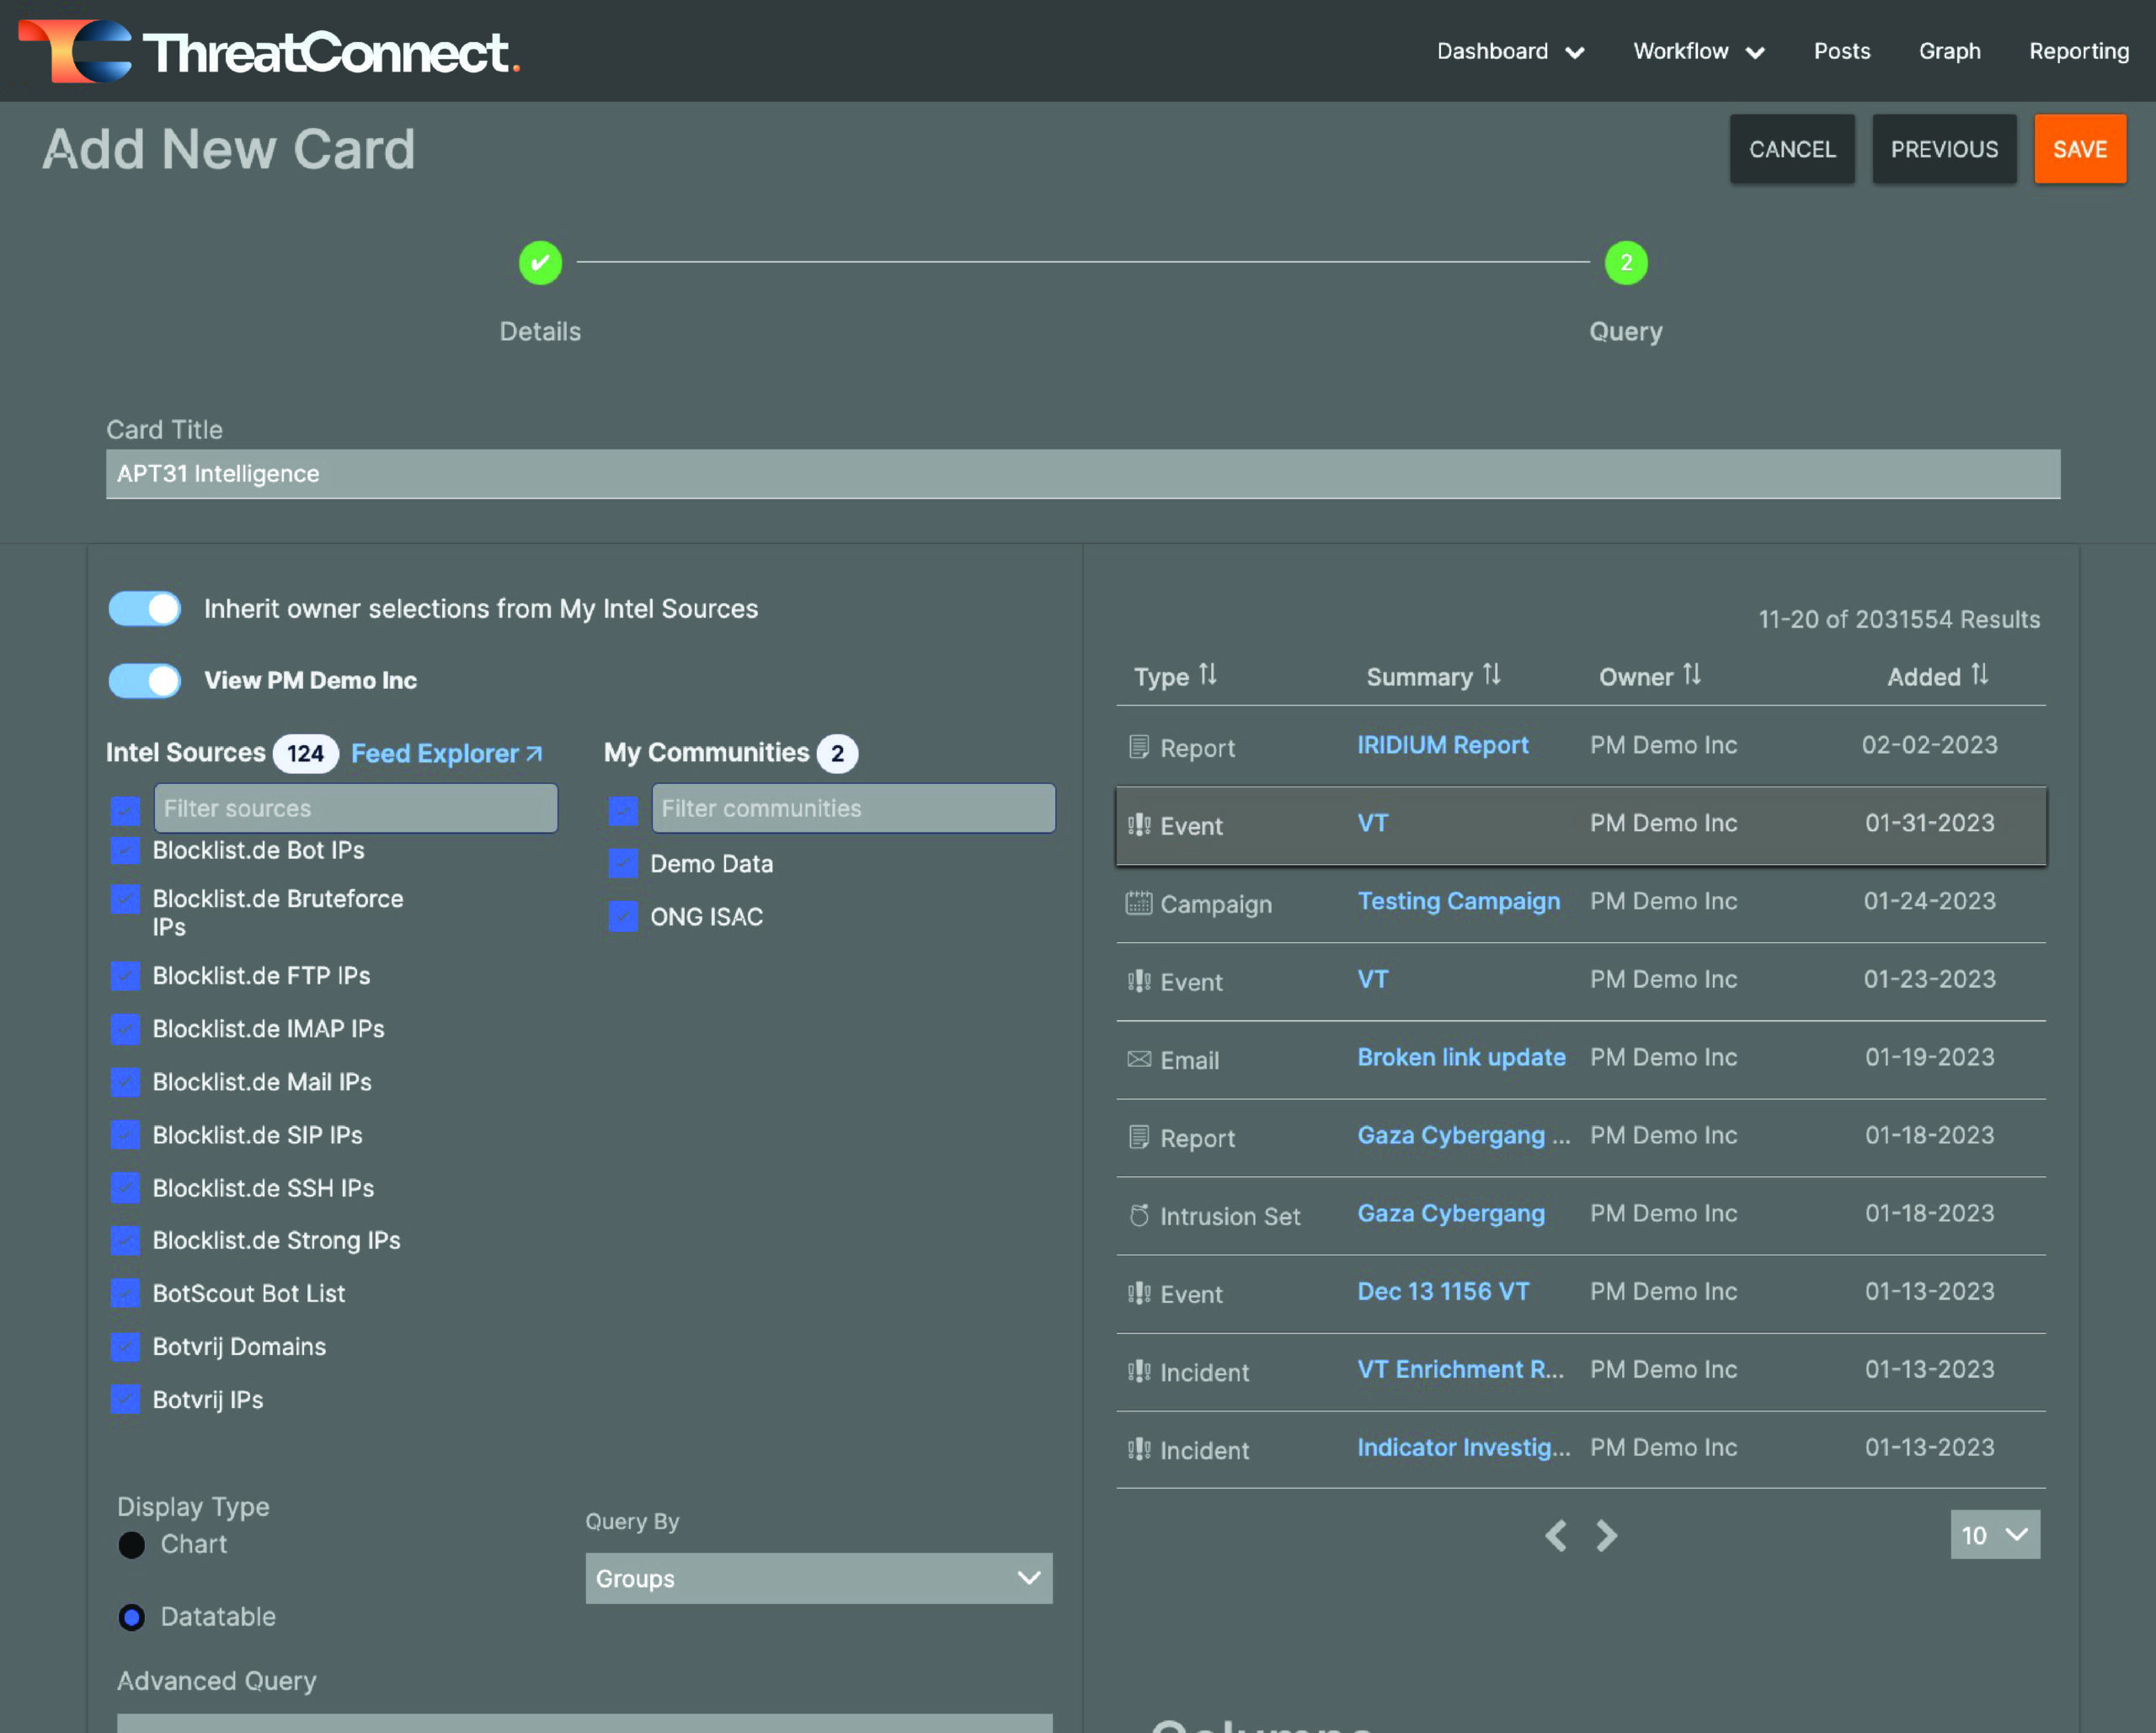
Configure your card and click save
Then, when you’re happy with your configurations, click the orange Save button at the top right corner of the drawer.
As with the My Recent History card, you can move the data table card around and resize it to your own preferences. Because I am actively investigating APT31, I chose to put the card at the top of my dashboard and expand it so I could clearly see the full first page of results.
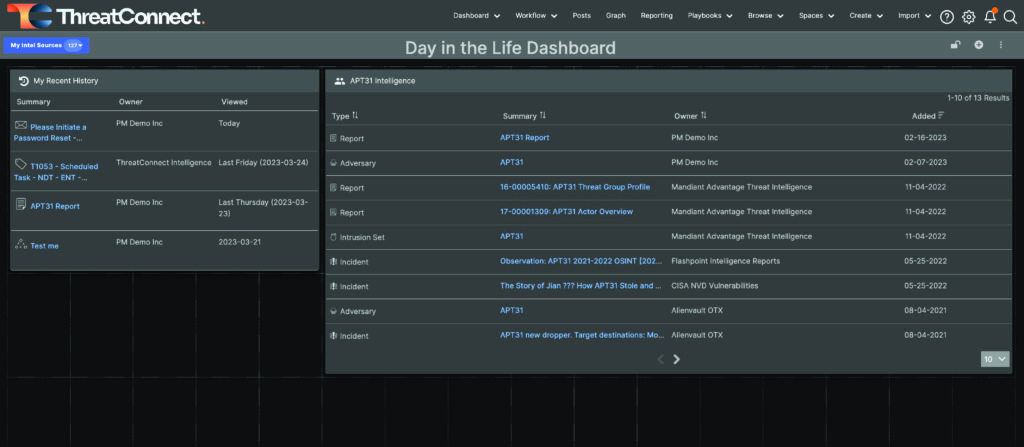
Resize and move dashboard cards to meet your own preferences
Repeat the steps under step 3 to add whatever dashboard cards you want. My next card is “My Open Case Tasks.” This widget is similar to the My Recent History card, and it helps me ensure I’m keeping up with any tasks assigned to me.
More Cards!
Other cards that might be useful are additional query cards focused on intelligence requirements, threat actor groups, malware families, or other topics you might be tasked with following.
When you’re done adding cards, proceed to the next step.
Step 4: Lock, Share, and Default
When you’re done making changes to your dashboard, you can lock it by clicking the Lock icon at the top right corner of the page. A menu to the right of the + icon gives you the option to copy, rename, share, delete, and export the dashboard. You can also set your new dashboard as the default on your account.
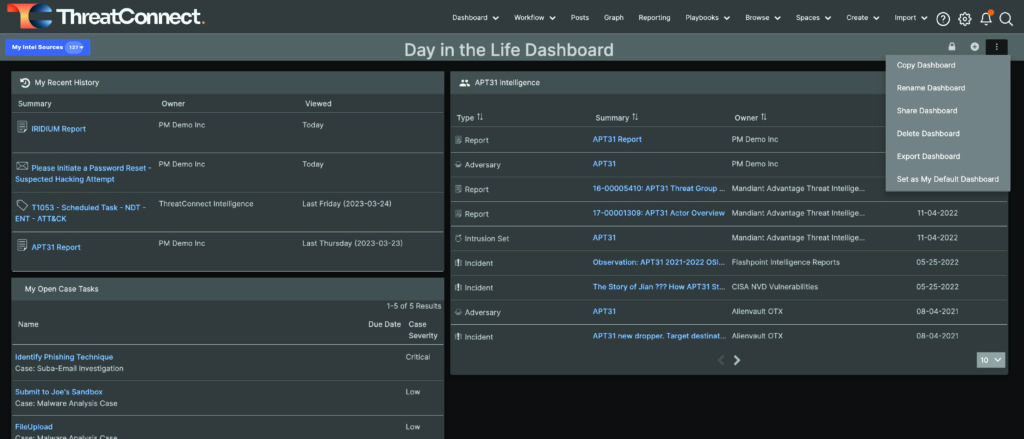
Dashboard options menu
In my case, I created a dashboard specifically to help me keep track of the items I cared about, and I set that dashboard as my default so that I would immediately see the things that matter to me when I log into the Platform.
This post laid out the steps for building a dashboard, focusing on some of the cards you might want to add if you’re a threat intelligence analyst using ThreatConnect. That’s just one type of dashboard. Some of our users leverage dashboards to keep track of vulnerabilities and ATT&CK techniques of interest. Other users create dashboards that keep track of open tasks and cases. One of my colleagues used dashboards to monitor how well a Yara hunting process was working. What other dashboards have you created? Are there particular dashboards that you’ve found especially useful in your work? Please share that with us via your customer success manager or our feedback portal, and we’re always looking for feedback on the dashboards themselves. Please share any and all feedback with us through those methods. We’d love to hear from you!
Next Up
In part 3 of this blog series, we will finish the Getting Started portion by discussing how threat intelligence analysts and threat intelligence teams can leverage Workflow to capture and guide their processes and document their investigations.
Ready to learn more?
If you would like to learn more about the Platform or get a demo, please reach out to our experts now.