Connect the Dots with Threat Graph
Threat Graph allows analysts to visualize, interact, and explore threat intel enabling them to discover relationships and take action to stay ahead of attackers and keep the enterprise secured.
Find New Insights in Your Threat Intel
Actionable insights come from discovering and understanding relationships among threat intel data points. These connections are difficult to see from text alone. Threat Graph allows your team to quickly analyze intel visually.
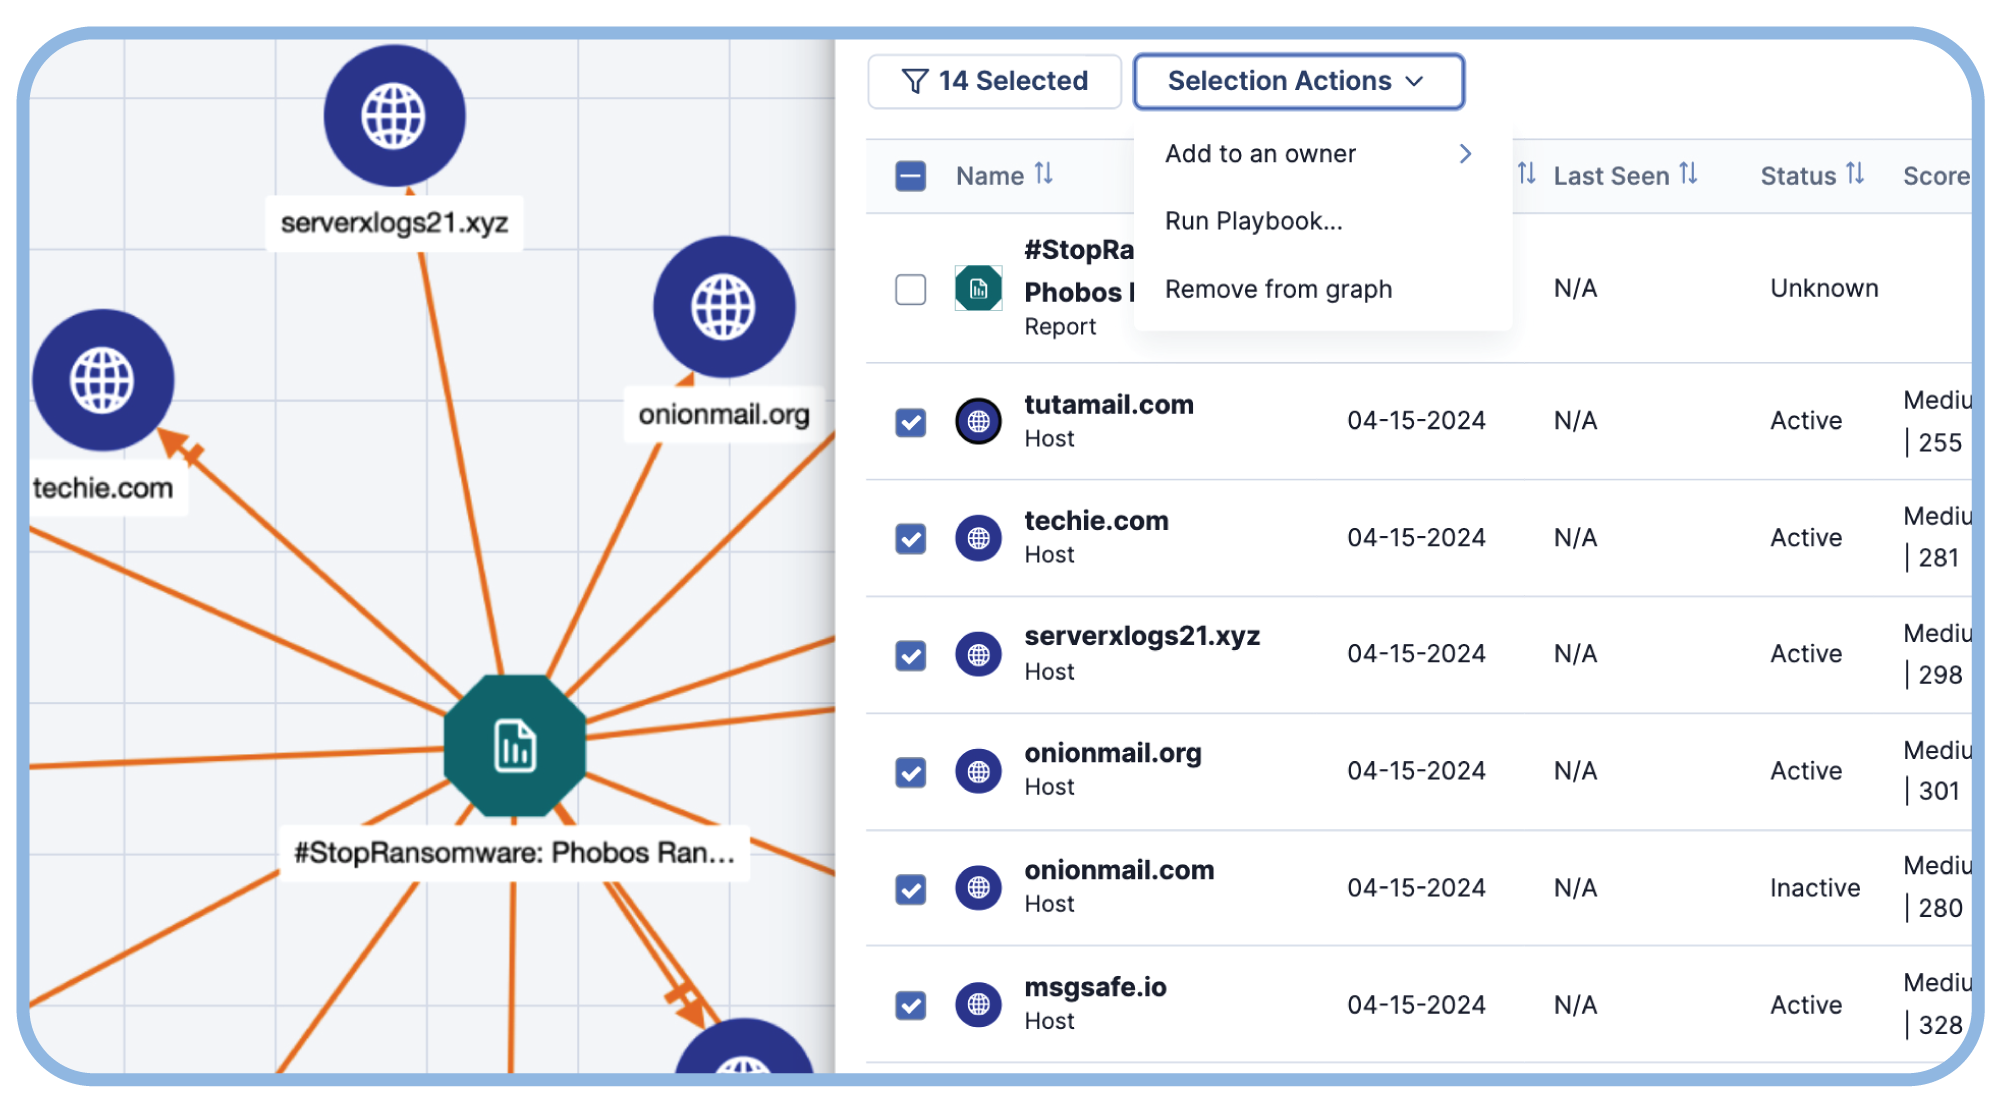
Easier Intel Analysis
Get details on intel, pivot across their data points, gain insights from the ThreatConnect user community, automatically enrich intel from a variety of sources, and take action with playbook automations.
Collaborate Effectively with Teammates in the SOC
Easily share graphs with SOC analysts, IR teams, and threat hunters to foster greater understanding and collaboration.
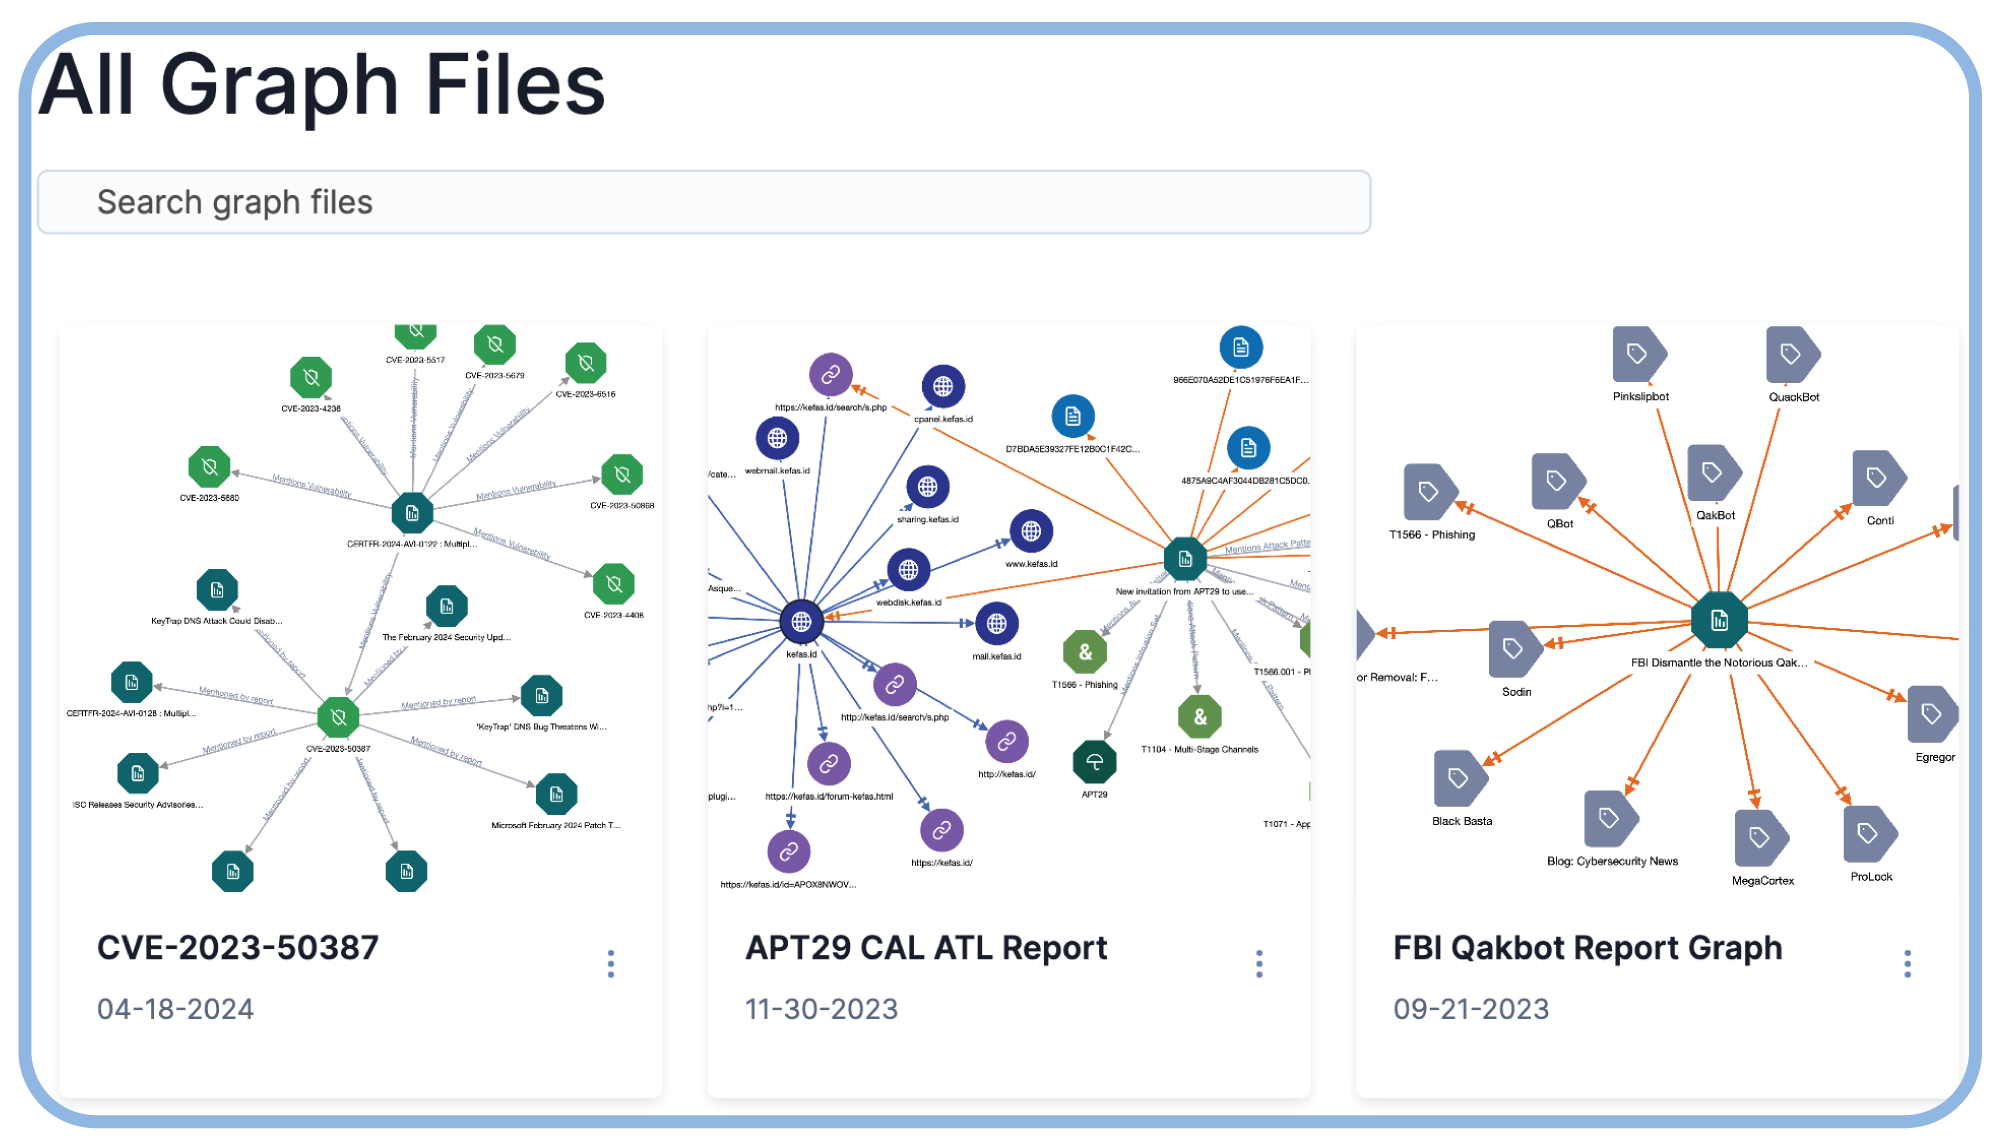
See, Explore, and Respond
Seeing is Believing
Change the game against attackers by allowing your analysts to visualize connections between disparate data points.
See Threat Graph in Action
Explore the interactive demo to see how Threat Graph allows you to visualize your data.
Choosing A Modern Threat Intelligence Platform
Know your options to choose the right platform for your needs.