Posted
This blog post is for boots-on-the-ground security analysts. Managers, turn back now! By the end, you’ll be able to create a tailor-made dashboard in ThreatConnect to help inform your day-to-day activities.
“Flash! Ah-ah! Savior of the universe!” -Queen
I cringe a little bit whenever I hear someone say that dashboards are just to show “pretty pictures” to a group of ivory tower executives. All flash, no substance. Yes, bubbling up certain metrics to leadership is important for justifying investments, demonstrating success, and tracking progress, but “pretty pictures” are more the purview of a report, not a dashboard. A dashboard is about monitoring. What do I need to know now — to stay on top of — to do my job?
We’ve covered some dashboarding best practices in the past. Think about your car dashboard: it shows you key stats you need in the moment, like how fast you’re going, or critical warning indicators. It does NOT show a pie chart of the most recent speed limits, or a pew-pew map of where you’ve been honked at. And yet, looking at how most infosec dashboards are advertised, we see something like this, very often animated:
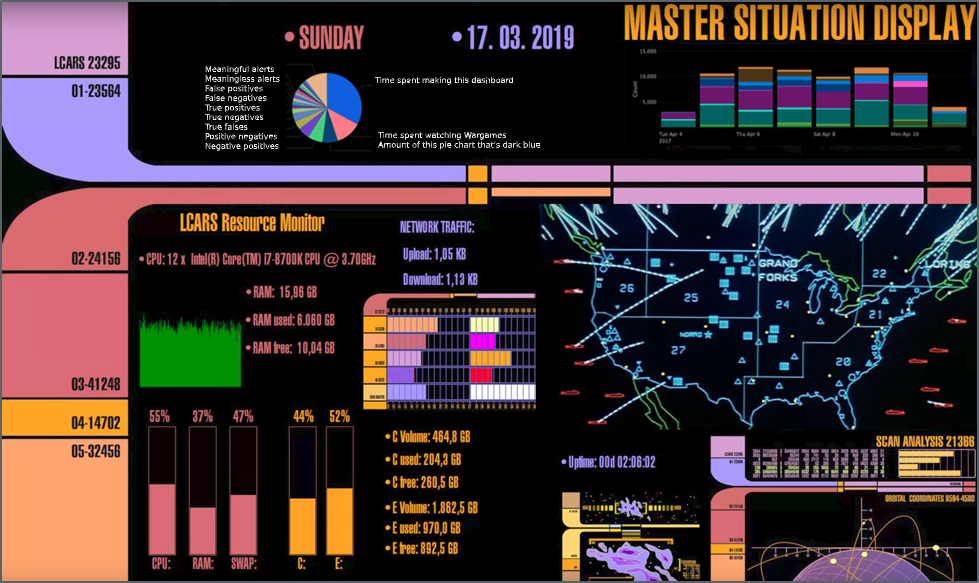
A strange dashboard. The only winning strategy is not to use it.
I get it. There’s a reason that Las Vegas is full of blinky lights and colorful carpets and plinky sounds: our barely modern monkey brains will PAY ATTENTION! THINGS ARE HAPPENING! LOOK AT ME LOOK AT ME LOOK AT ME! And so a bright, beautiful dashboard is going to make people look, and hopefully get curious, and when all the flash is finally peeled away there will be some valuable substance underneath. Unfortunately, this very flash dooms dashboards to misrepresentation as mere pretty pictures.
A Better, Boring-er Way
There are plenty of good reasons to include bar graphs and colors on dashboards if they’re the best way to convey necessary information, but imagine seeing this projected on a 10×10 screen on a tradeshow floor:
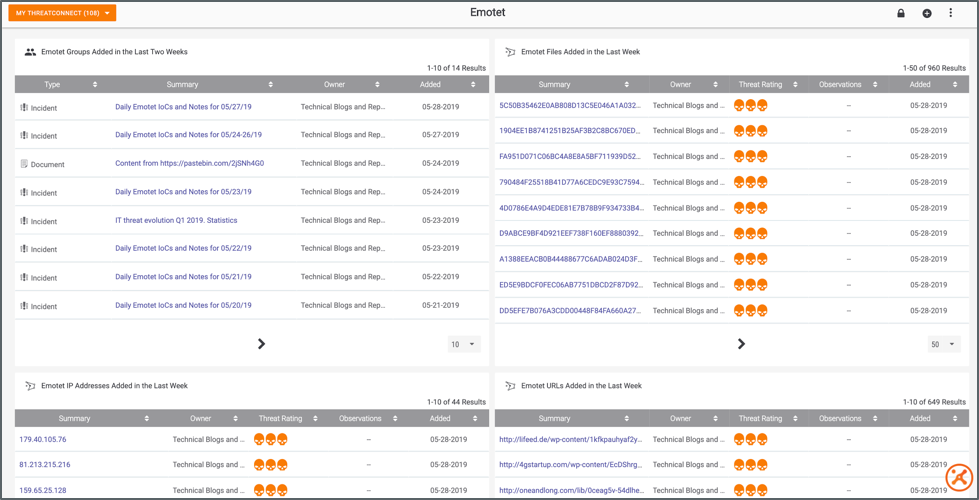
Pfft. Data tables? How will I get my bosses to pay attention? What will I animate???
This dashboard is NOT sexy. It will NOT cause your brain to release dopamine just by looking at it. BUT if you create a dashboard like this that’s tailor-made to your workflow, it just might help you do your job more effectively. Let’s see how.
Tabula Rasa
ThreatConnect lets you create special dashboard cards called “datatables.” Using ThreatConnect Query Language (TQL), you can construct these datatables tailor-made to your specific workflow. Ideally, your workflow is not just blindly triaging alerts; you have some method to the madness. Some focus area of expertise, ideally driven by intelligence and infosec requirements linked to business risk. For example:
- Targeted attacks against your industry vertical (e.g. finance, manufacturing, etc.)
- Threats related to your cloud infrastructure
- Physical security matters
- Specific classes of malware (e.g. ransomware)
- Different tactics or techniques driven by the ATT&CK framework
You can also create dashboards purpose-built around your or your team’s Priority Intel Requirements (PIRs), which we’ll cover in a future blog article:
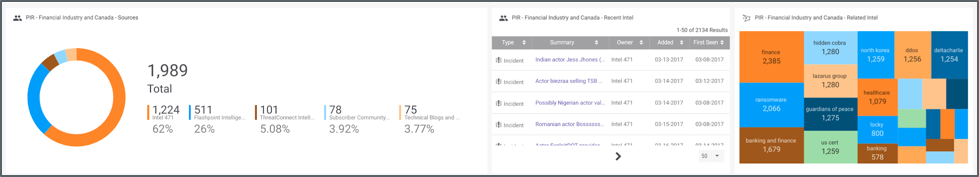
A “small multiple” on a PIR dashboard, in this case dealing with threats related to financial institutions in Canada, that shows relevant feeds, new intel, and related topics.
Once you’ve identified the requirements that are driving your day-to-day, you can start creating datatable-driven dashboards that bubble up meaningful results so they’re the first thing you see when you log into ThreatConnect:
- Are there new indicators related to the threats I care about? (either reported by a feed or alerted on or observed internally)
- Is there new high-level intelligence I could be acting on? (from a feed or created internally or by a Playbook)
Creating a Relevant Dashboard
Let’s say you’re tracking threats targeting financial institutions. You might want to see intel (both Groups and Indicators) in ThreatConnect tagged with that industry as well as threat actors and malware that traditionally target your sector. That way you’re constantly and consistently monitoring the data that’s relevant to you. Rather than, “here’s a pretty pie chart that tells me nothing,” it’s “my favorite feed just published a report on an APT I’m tracking and our SIEM recently observed a domain related to a malware variant we’ve been on the lookout for.”
To start, hover over the Dashboard link in ThreatConnect’s main menu, then select “New Dashboard.” Give your dashboard a descriptive name.
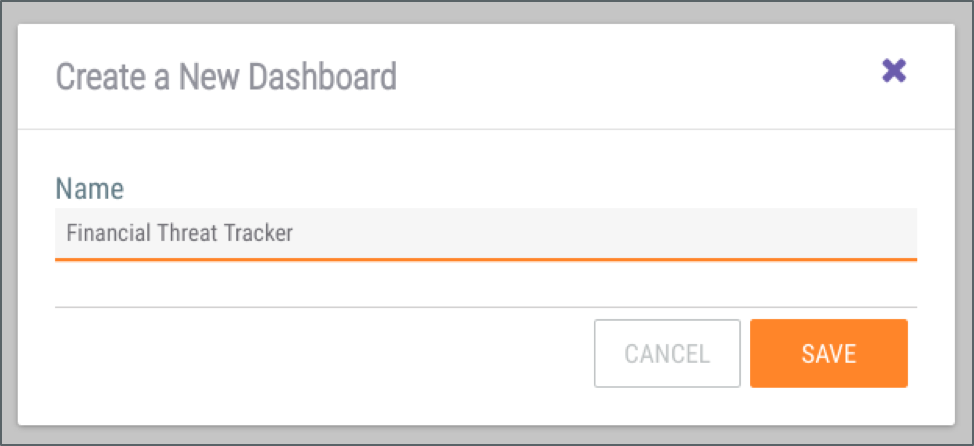
You can create as many dashboards as you want!
Then click the prompt to create your first dashboard card, give your card a title, (e.g. “Groups Tagged with Finance Sector Tags”), and select the “New Query” option. On the next screen, specify that you want to create a datatable. This is where the magic happens.
The “Advanced Query” section lets you use TQL to ask simple to exceptionally complex questions of the data in ThreatConnect. Everything from “show me all Indicators tagged ‘banking’” to “show me all Adversaries in China who have been linked to Incidents that leverage ATT&CK Technique T1192 that have Indicators observed in the last 90 days.”
Depending on your query and how you want the data grouped, you’ll be able to pick and choose the fields you want to include in your table:
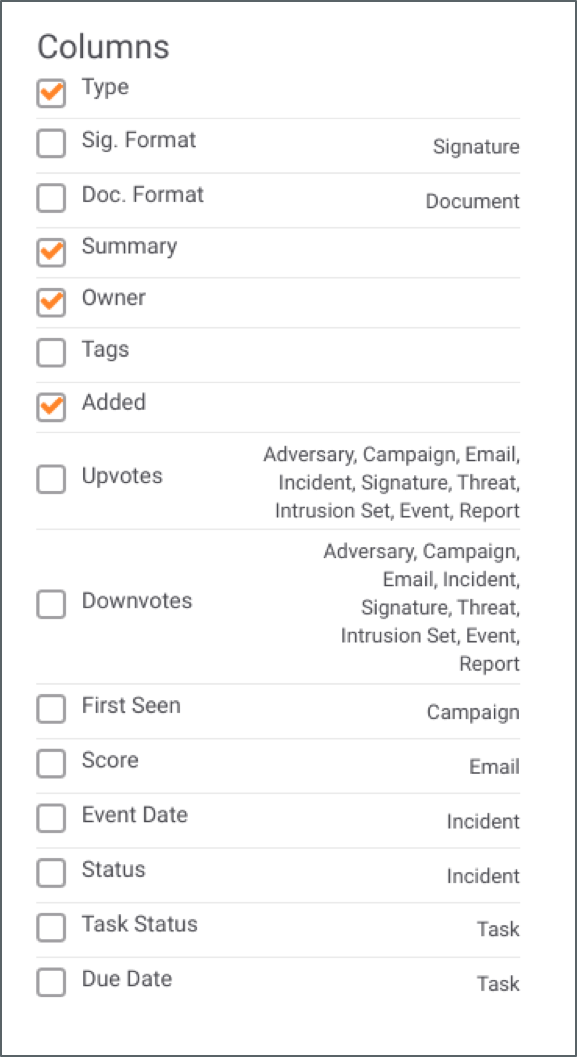
Options will vary based on your other selections.
For our example dashboard, we want to create four cards: two that show Indicators and Groups explicitly with tags related to Finance, and two that show Indicators and Groups related to threats or adversaries that are known to target Finance. Here’s the TQL for each card:
Groups Tagged with Finance Sector Tags
typeName in ("Threat", "Adversary", "Incident", "Campaign") and tag in ("Finance", "Financial", "Banking", "Banking and Finance", "Finance and Banking") and dateAdded >= "NOW() - 360 DAYS"
Groups Tagged with Threats Relevant to Finance
typeName in ("Threat", "Campaign", "Incident", "Adversary") and tag in ("Carbanak", "Fin7", "Hidden Cobra", "Lazarus Group", "Guardians of Peace", "APT37", "Anunak", "Teleport Crew", "Suckfly", "APT10", "Stone Panda", "menuPass", "Emissary Panda", "APT27", "Molerats", "Suckfly", "Locky") and dateAdded >= "NOW() - 360 DAYS"
Indicators Tagged with Finance Sector Tags
typeName in ("Address", "EmailAddress", "File", "Host", "URL", "ASN", "CIDR", "Mutex", "Registry Key", "User Agent") and tag in ("Finance", "Financial", "Banking", "Banking and Finance", "Finance and Banking") and dateAdded >= "NOW() - 360 DAYS"
Indicators Tagged with Threats Relevant to Finance
typeName in ("Address", "EmailAddress", "File", "Host", "URL", "ASN", "CIDR", "Mutex", "Registry Key", "User Agent") and tag in ("Carbanak", "Fin7", "Hidden Cobra", "Lazarus Group", "Guardians of Peace", "APT37", "Anunak", "Teleport Crew", "Suckfly", "APT10", "Stone Panda", "menuPass", "Emissary Panda", "APT27", "Molerats", "Suckfly", "Locky") and dateAdded >= "NOW() - 60 DAYS"
You should end up with a dashboard that looks something like this:
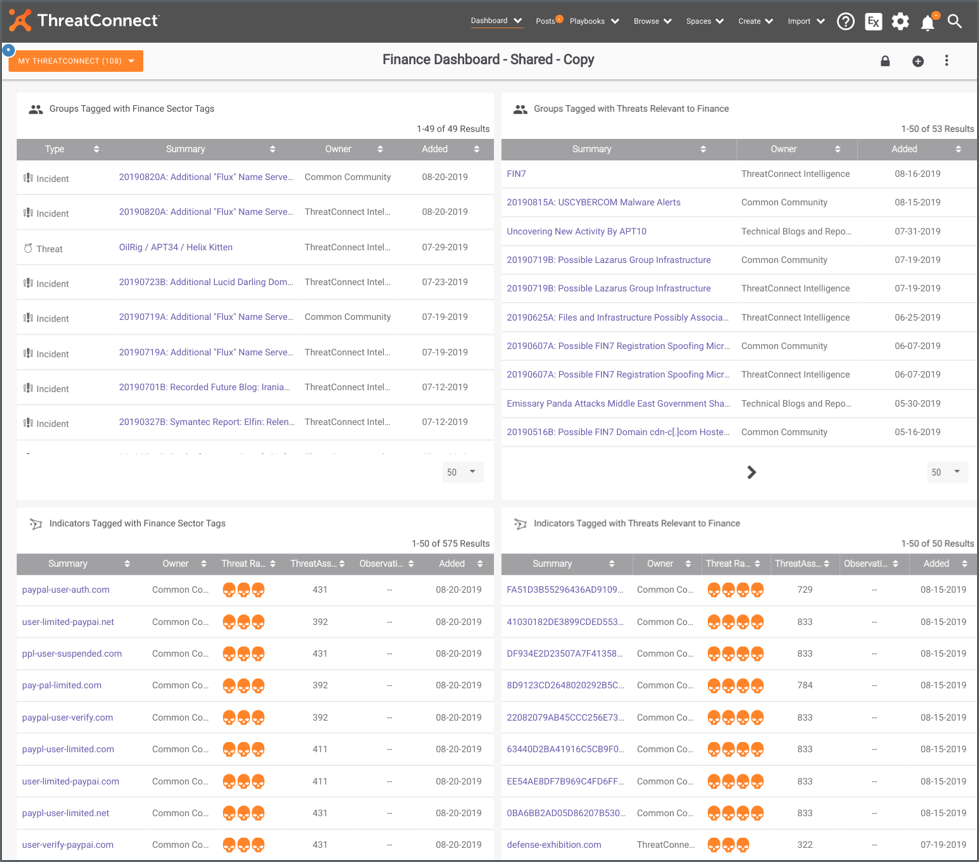
Perfect for reviewing each morning over coffee.
And there you have it! It’s not pretty to look at, but it does help you create habits and keep on top of the specific infosec requirements you are responsible for on a daily basis. Spend some time thinking through the types of threats you and your organization care about, then customize the TQL samples above to create dashboards that really matter to you.
Where to Go Next
To learn more about dashboards, check out this overview. As always, for product feedback, please contact me directly at dcole@threatconnect.com. If you’re a customer and would like to share your best practices or ask questions related to dashboards, please reach out in our customer Slack workspace!
Special thanks to Kyle Ehmke on our Research team for providing the TQL and inspiration for this post!