Posted
CTI analysts constantly face the challenge of staying on top of a growing and evolving stream of threat data. Reading and processing intel from diverse sources like vendor reports and blogs can be overwhelming.
There is the additional challenge of which intel requires the most focus: indicators of compromise that can be detected and blocked (like IP addresses) or a threat actor’s known tactics, techniques, and procedures. The former is still helpful for filtering potentially malicious traffic. Still, it can lead to false positives and has low impact, while the latter – although more challenging to detect – has increased fidelity and is more impactful.
And it doesn’t stop there. Reporting to stakeholders can also be challenging if they can’t quickly understand and process the threat intel information and recommendations, as they might lack the time or inclination to read reports or extract relevant insights. Conversely, an analyst may receive requests for specific insights on Groups, Techniques, and defense posture they need to communicate accurately and quickly.
The MITRE ATT&CK Solution
To meet these challenges, CTI analysts have leveraged the MITRE ATT&CK framework to better understand how threat actors operate, improve threat detection, and implement protections to prevent or mitigate threats before an adversary attacks.
Applying ATT&CK allows intel and operational teams to map out specific tactics and techniques used by threat actors. This includes understanding their procedures, tooling, and behaviors. The advantages of an engineered TTP detection strategy are a longer lifespan with fewer false positives compared to an indicator-based strategy. TTPs can be overlaid against organizational defenses to identify gaps or over-investments, so defenders can make it more challenging for adversaries to compromise the organization.
With the power of ThreatConnect’s ATT&CK Visualizer, CTI Analysts can leverage the MITRE ATT&CK framework directly in the TI Ops Platform (and not have to use a separate tool, like the ATT&CK Navigator).
In this blog, we’ll examine three critical challenges CTI analysts regularly face and how ThreatConnect ATT&CK Visualizer can help:
- Evolving their CTI capabilities to not focus solely on indicators of compromise
- Assessing and sharing insights on the latest threat actor behaviors.
- Finding relevant data that meets their organization’s specific intel requirements.
- Determining what security controls coverage an organization has against known threats.
How ATT&CK Visualizer Helps
ThreatConnect’s ATT&CK Visualizer is designed to help analysts navigate and understand potential cyber threats and threat actor behaviors. Through ATT&CK Visualizer, CTI analysts can create custom, standard views of the MITRE ATT&CK framework directly within the TI Ops Platform. The framework’s usefulness is attained through standardized codes and descriptions of threat actor tactics, techniques, and sub-techniques – used by a wide array of cybersecurity professionals – which together allow for categorizing and defining the goals and actions of threat actors.
Efficient Assessment and Sharing Insights
MITRE ATT&CK offers a structured framework for describing adversary tactics, techniques, and sub-techniques. This allows analysts to compare groups and defenses, addressing challenges. It provides a common language, helping to clarify communication among the security team and facilitating comprehensive analysis of ATT&CK techniques from diverse sources.
ThreatConnect’s ATT&CK Visualizer structure is derived directly from MITRE ATT&CK Navigator, mirroring the same tactics, techniques, and sub-techniques. Each column corresponds to a tactic, outlining a threat actor’s goal. The number on each column indicates the techniques associated with that tactic. Within each tactic column, you’ll find a series of cards representing techniques, denoting the methods employed by threat actors. These cards also display the number of sub-techniques associated with each technique.
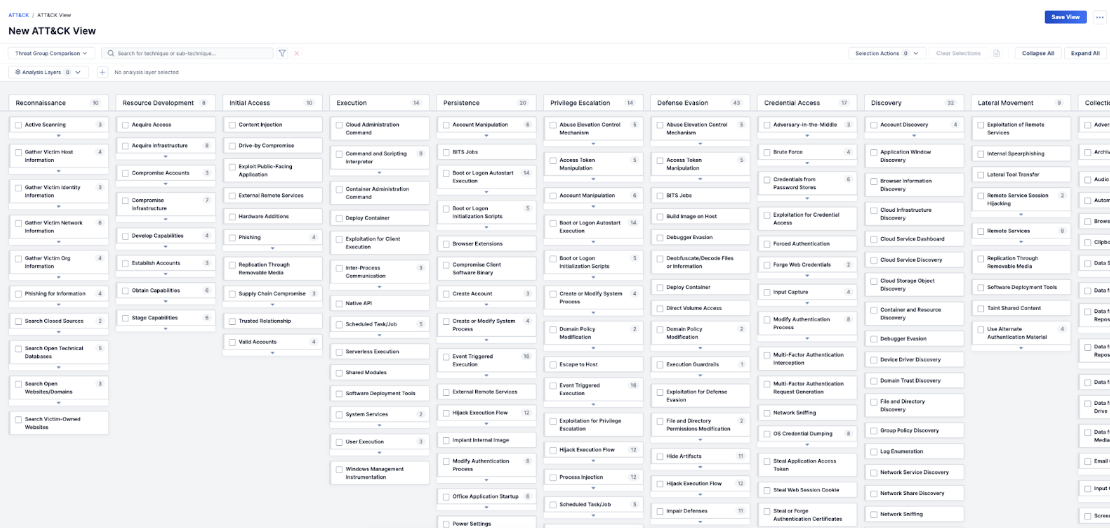
This structure gives analysts a standard set of definitions for threat actor behavior they can use to ensure clear communication. Moreover, because ATT&CK Visualizer is embedded in the TI Ops Platform, accessing and sharing threat intel is even more efficient for ThreatConnect users.
Finding Relevant Data
The entirety of the MITRE ATT&CK Threat Matrix provides a library of known threat actor actions. It can still be overwhelming even when looking across the broad spectrum of this information. CTI Analysts often need to analyze with a prescriptive goal and only need a filtered and curated view of the information they need. One typical example is when they are researching which Groups use similar techniques that their org has determined is a high-priority threat to monitor.
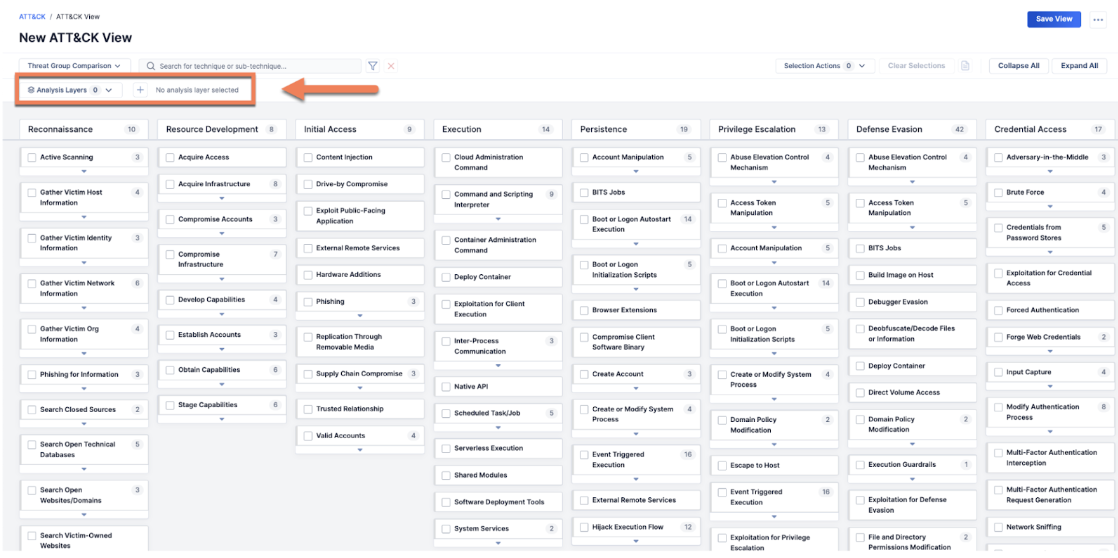
ATT&CK Visualizer empowers CTI analysts further with features to create standard ATT&CK views, helping CTI Analysts uncover shared tactics among groups and identify prevalent threats.
Once Views are created, users can also apply layers to their views for more specific research, such as Threat Group Comparison and Technique Prevalence. Another layer – unique to ThreatConnect ATT&CK Visualizer – users can apply is the Security Coverage layer.
For example, an analyst wants to compare Threat Groups APT 42 and APT 34. They would create a new view and then add a Threat Group Comparison layer identifying those two groups. They could then see which techniques only APT 42 uses, which only APT 34 uses, and which they both use. The techniques they share may then become a higher priority to defend against.
Assessing Security Control Coverage for Known Threats
As a CTI Analyst, you could promptly convey specific insights on Groups, Techniques, and your organization’s defense posture. In such cases, having this data at your fingertips would be helpful. Often, an organization’s collective knowledge and memorialization of its overall security controls coverage is scattershot and can leave an analyst flat-footed when asked for a quick assessment. The more common this assessment becomes, a CTI analyst’s understanding of what and how to assign security control coverage to techniques and sub-techniques is paramount.
It’s in these scenarios where ATT&CK Visualizer’s Security Controls Coverage layer feature comes into play.
For example, the CTI Analyst might collaborate with internal security teams, like the SOC and vulnerability management, to assess and assign a level of security control coverage the org has against a specific technique. Following this internal assessment, the CTI Analyst assigns security control coverage levels to each technique in ATT&CK Visualizer directly in the TI Ops Platform, capturing and centralizing the assessment.
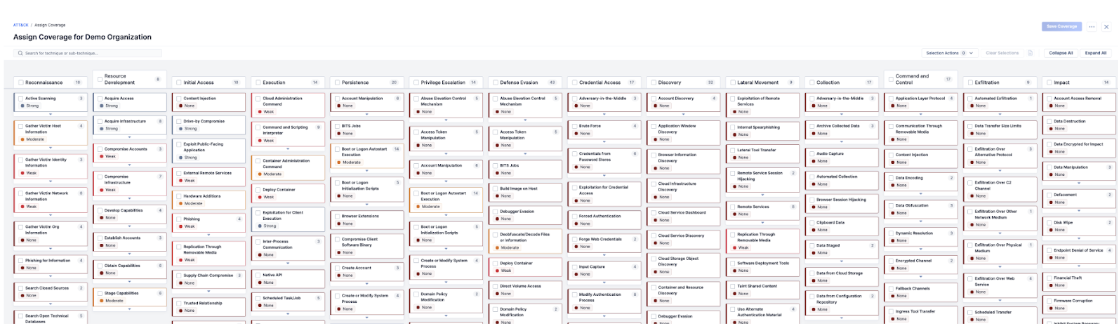
This capability allows security teams to assess and capture an org’s defensive strengths, identify security controls coverage gaps (and over-investments in an area), and subsequent defense enhancements.
ThreatConnect’s TI Ops Platform offers a comprehensive solution that leverages the power of ATT&CK Visualizer and other features to strengthen your ability to detect and resist attacks. Take a tour to learn more about ATT&CK Visualizer or schedule a demo with one of our experts.