Request a Demo

Polarity

If you had a photographic memory, how much faster would you be at your job? Now what if you had a collective memory across all members of your team, organization, or industry, how much better would you be at your job? Polarity has developed a technology that makes this possible through software. The system analyzes the contents of users’​ computers screens and gives them real-time access to information without affecting their existing workflow. The system makes it easy to capture new “memories”​ so that if other users are looking at similar content, they will automatically be notified of the most relevant information at the most opportune time.

Integrations

Polarity Forms

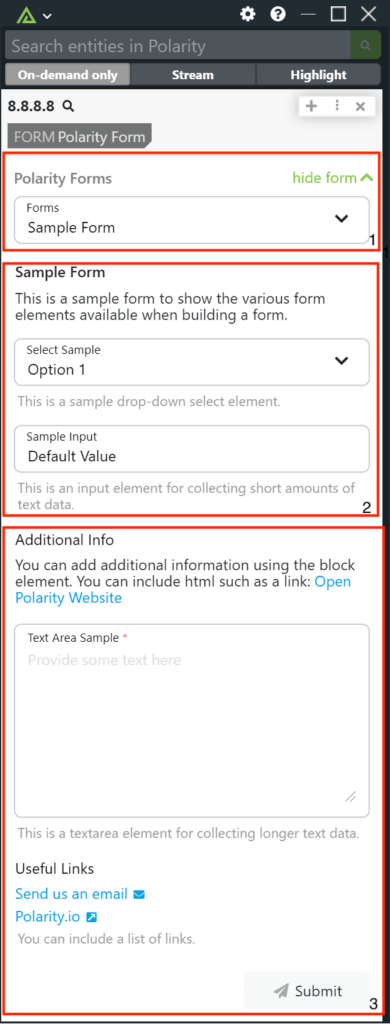
The Polarity Forms integration enables analysts to quickly send pre-defined emails and forms to other teams. The emails and forms are predefined and enable the data from integrations to be sent in the form allowing the receiving teams to quickly triage the email/form request.

Examples

Polarity Forms Data Overview

  • Form Selection: When using the Polarity Forms integration, analysts can quickly select which form has been setup in the integration.
  • Form & Additional Context: Each form has their own information and context associated with it. Where you can quickly fill out the necessary information and take actions.
Keep Reading

Related Resources

Built By Polarity

Polarity Detection Forms

The Polarity Detection Forms integration enables users to submit form-based detection feedback or requests via email. The integration can be easily customized with your own forms by providing custom form configurations.

Examples

Polarity Detection Forms - New Rule Nomination

  • New Rule Nomination

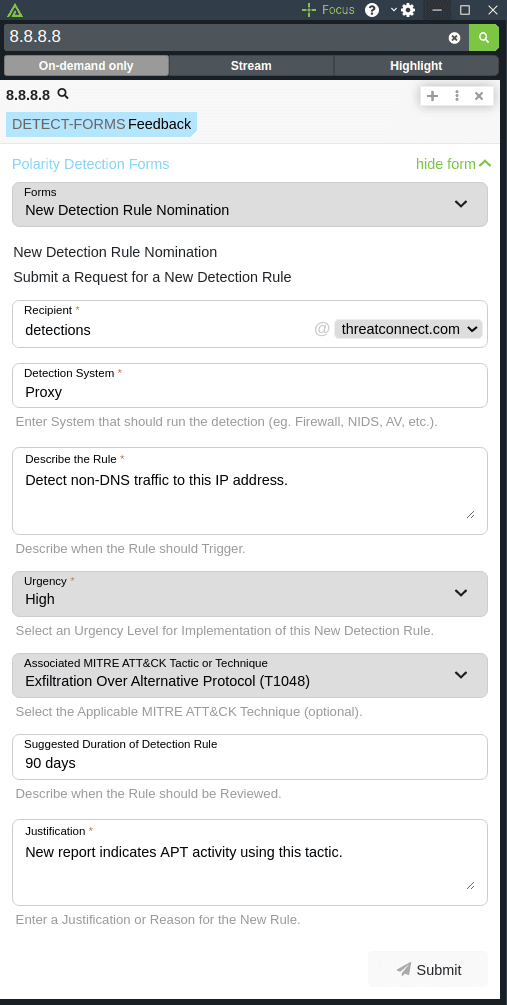
When running the Polarity Detection Forms integration an analyst can use the New Detection Rule Nomination form to create a nomination for a rule.

Analysts can quickly create a new detection rule nomination allowing teams to quickly look at new rules coming through and deciding to add them as a a full rule.

The form allows analysts to specify a Mitre technique, add a description on what the rule is, set a jurisdiction and more. Allowing teams to quickly add and adjust new rules to their systems.

Polarity Detection Forms - Existing Rule Feedback

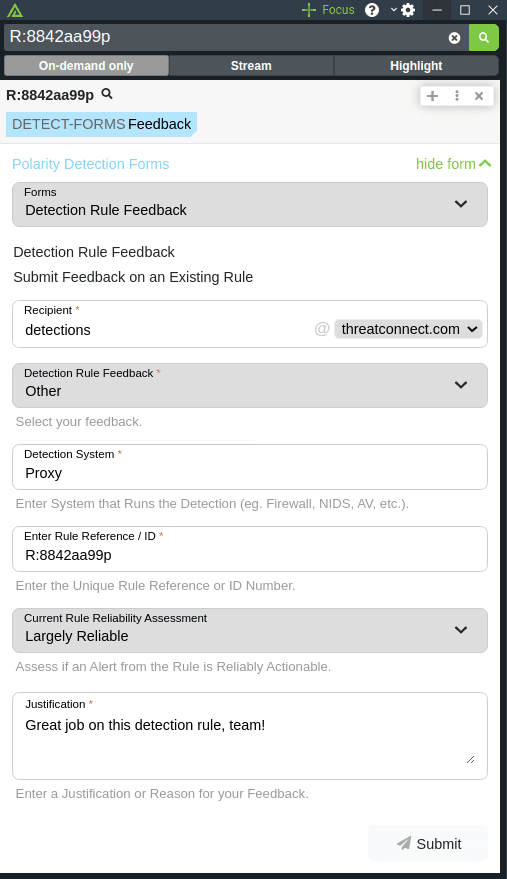
  • Existing Rule Feedback

Analysts can also provide feedback on current rules to detection teams, allowing teams to quickly adjust and change rules to better protect their networks.

Keep Reading

Related Resources

Built By Polarity

Sandboxes

The Polarity - Sandboxes integration utilizes the Google Custom Search Engine to search different sites for insights into malware.

Please check out the reference links for all the sites the integration utilizes.

For more on Google Custom Search Engines please see: https://developers.google.com/custom-search/v1/overview

Examples

Sandboxes Data Overview

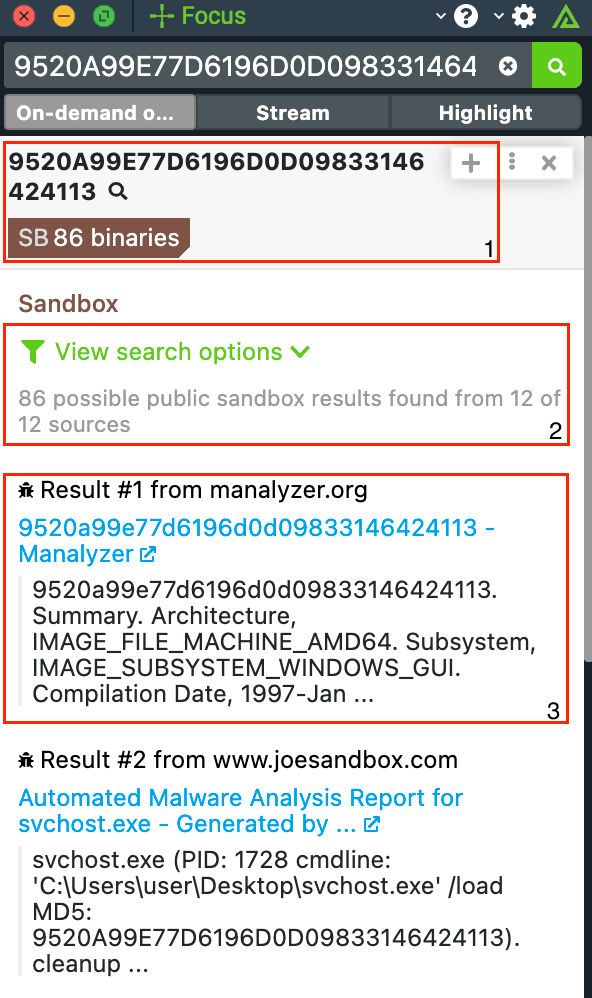
  • Summary Tags: When searching indicators with the Polarity - Sandboxes integration analysts can quickly see the number of associated search results.
  • Filter Searches: When drilling into the details of the integration analysts can quickly filter the results down by source to better find results analysts are looking for.
  • Results: While in the details of the integration analysts can see the results from searches and then pivot into the specified sources.
Keep Reading

Related Resources

Built By Polarity

URL Pivots

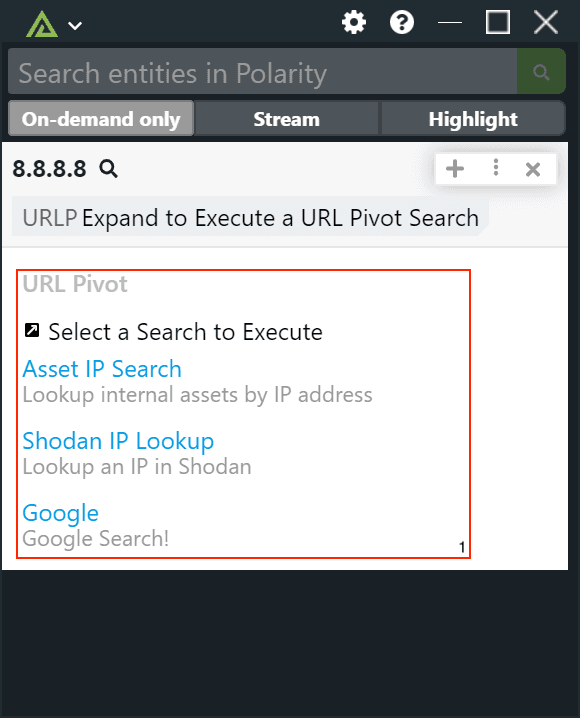
The Polarity - URL Pivots integration recognizes various entity types and allows an analyst to quickly pivot to custom SIEM search(es). Enabling analysts to have even more context whenever they need it.

Examples

URL Pivots Data Overview

  • Pivots: When using URL Pivots, the integration is to assist analysts by providing multiple pivot points to different systems analysts will need to access in their workflow. When drilling into the details, analysts can easily see the pivots in the integration and pivot out to the systems of interest.
Keep Reading

Related Resources

Built By Polarity

Font Changer

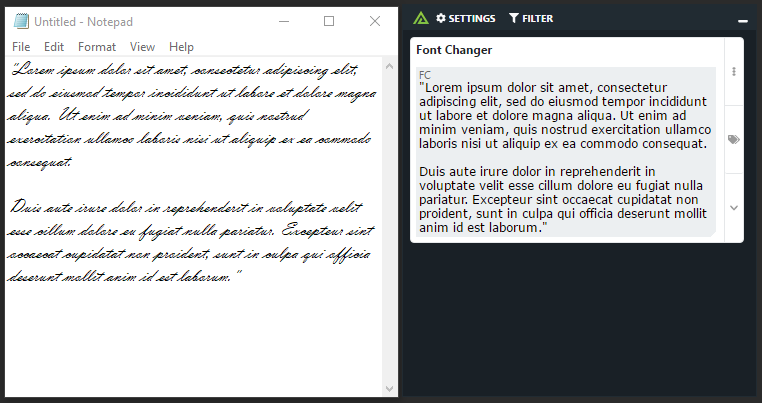
The Polarity Font Changer integration is an on-demand integration which converts the selected text into a new font and font-size. The integration is meant to improve accessibility in cases where fonts are difficult to read.

Keep Reading

Related Resources

Built By Polarity

Social Media Searcher

The Polarity - Social Media Searcher integration searches emails, and other text against Google's custom search endpoints to quickly find information from Twitter, LinkedIn and Facebook. Enabling analysts to have social media insights when doing different investigations.

Keep Reading

Related Resources

Built By Polarity

Security Blogs

The Polarity - Security Blogs integration utilizes the Google Custom Search Engine to search different sites for blog posts related to their searches.

Please check out the reference links for all the sites the integration utilizes.

For more on Google Custom Search Engines please see: https://developers.google.com/custom-search/v1/overview

Examples

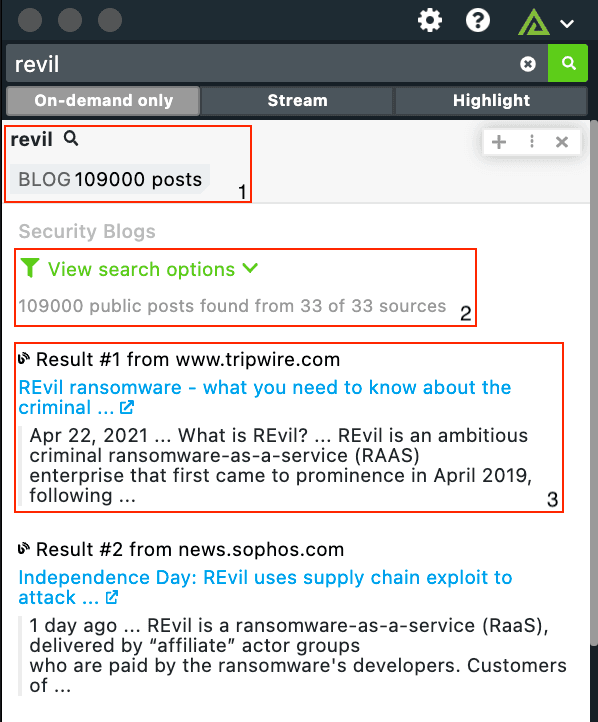
Security Blogs Data Overview

  • Summary Tags: When searching indicators across the different blogs, analysts can quickly see the number of associated blogs posts the indicator might pertain to.
  • Narrow Sources: When drilling into the details of the Security Blogs integration, analysts can quickly narrow their search results down to which sources they prefer.
  • Results: While looking at the details analysts can also quickly see the different results from the blogs. Here they can see a synopsis of the blog and then link out to read more.
Keep Reading

Related Resources

Built By Polarity

ThreatConnect with Polarity

The Polarity - ThreatConnect integration enables analysts to get the full power of ThreatConnect's vast threat intelligence platform. Analysts can quickly know where the information was derived from, the indicator analysis, any associations with the indicator and its threat and confidence profile. Enabling the analysts to quickly have the information they need from ThreatConnect to make quality decisions, quickly.

Examples

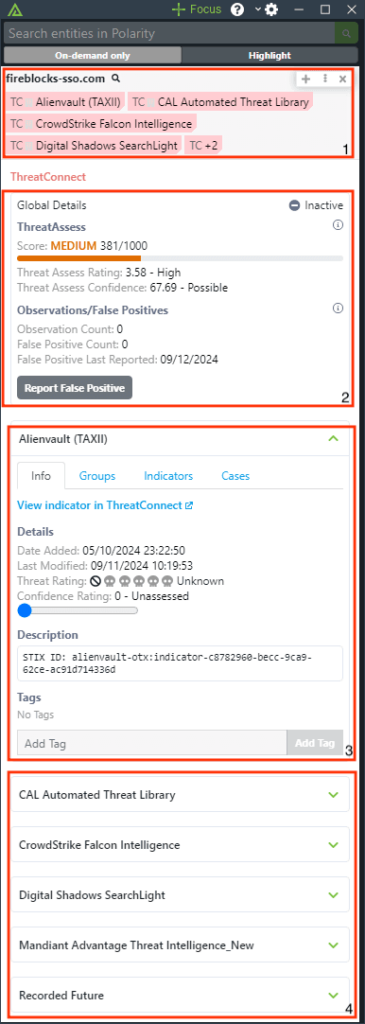
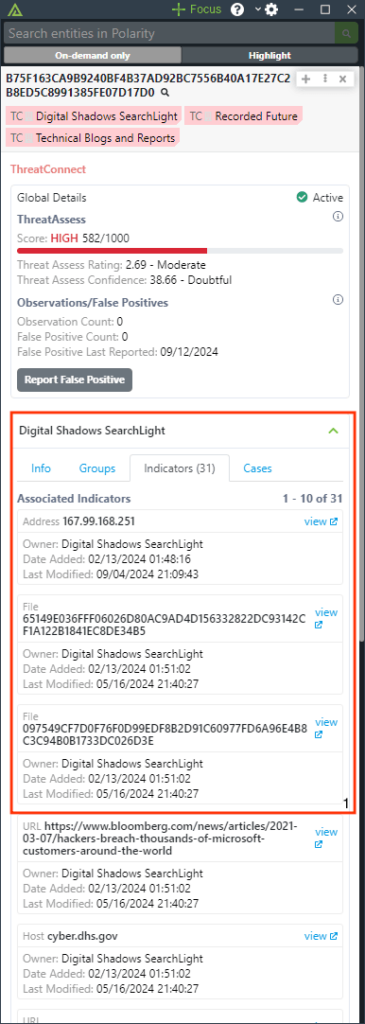
ThreatConnect Data Overview - Main View

  • Summary Tags: When searching an indicator in ThreatConnect, analysts can quickly see where the indicator originated from in ThreatConnect to get an understanding of the threat landscape before drilling in for more details.
  • Global View: When drilling into the details of ThreatConnect integration, analysts can quickly understand a global view of the indicator in ThreatConnect. Quickly being able to understand its Threat Assessment, observations and false positives and can see if the indicator is inactive or active.
  • Source Main View: When clicking on a source of information in the details of the ThreatConnect integration analysts can quickly see the associated information from that source about that indicator. From details, descriptions and more. Analysts can then add tags and adjust the confidence for that source
  • Additional Sources: Analysts can quickly pivot between the different sources that have information about the indicator.

    ThreatConnect Data Overview - Source Context

    • Source Context: When looking at the source analysts can quickly pivot to associated groups, indicators and cases. Enabling analysts to have more context from the different sources.
    Keep Reading

    Related Resources

    Built By Polarity

    ThreatConnect IOC Submission with Polarity

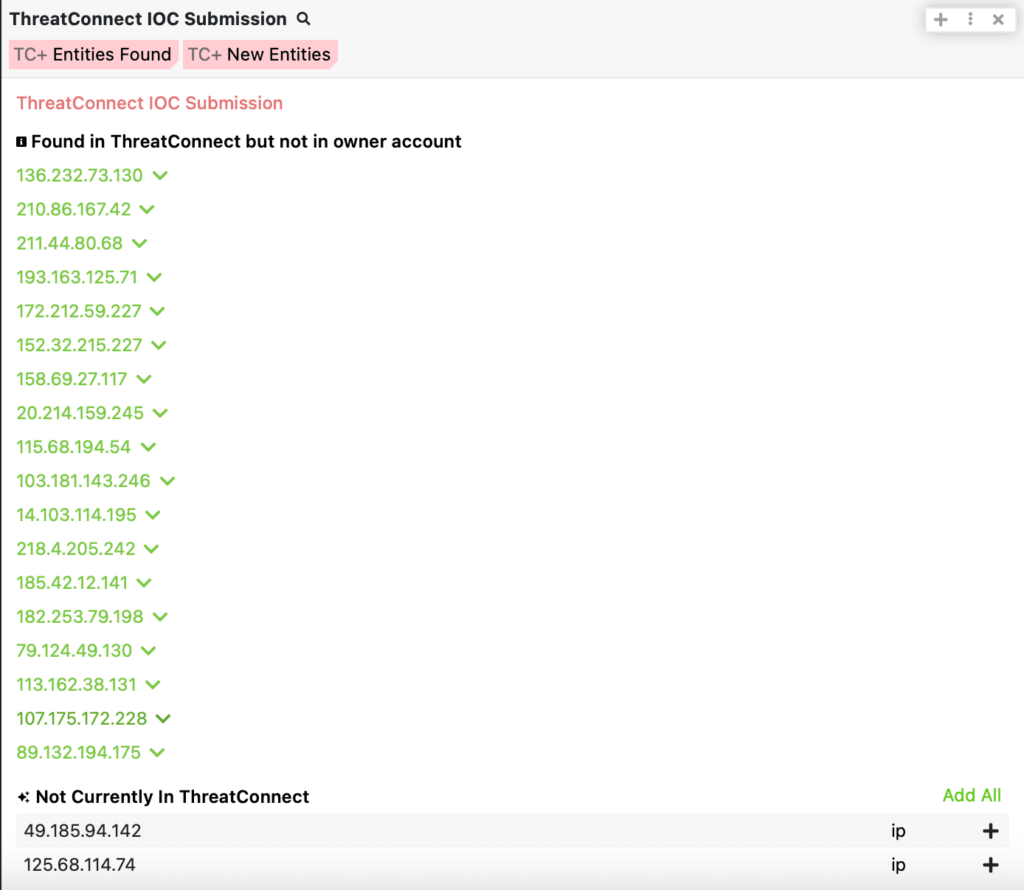
    The Polarity ThreatConnect-IOC-Submission integration allows Polarity to search your instance of ThreatConnect to return found domains, IPs, hashes, and emails. The integration also allows you to Create and Delete Indicators (IOCs) in bulk from ThreatConnect.

    Examples

    Data Overview - Indicator Instance State

    When running a search with the ThreatConnect IOC Submission integration, analysts will quickly be able to see what entities are contained in their ThreatConnect instance, which organizations/groups they belong with and if those indicators are not in their instance. Quickly being able to add them to their organization by hitting the plus button!

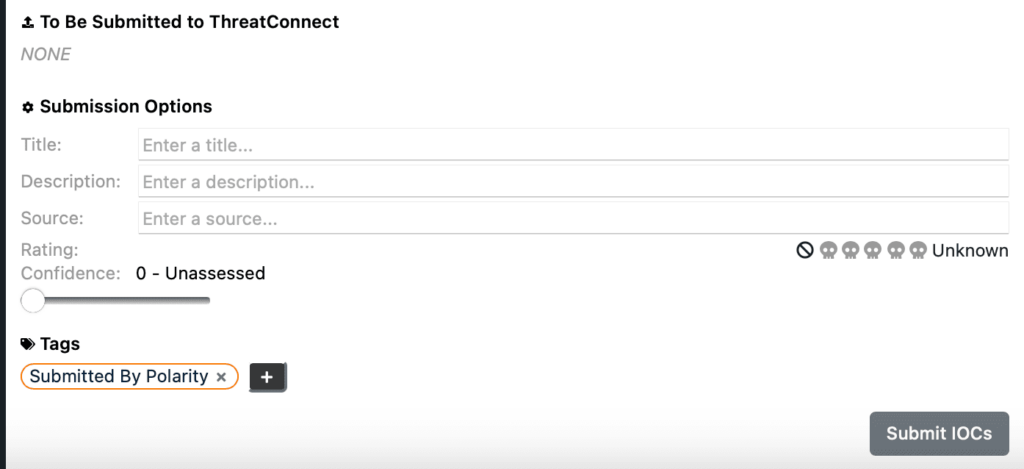
    Data Overview - Submission Options

    When scrolling down from the indicators that are in or not in your instance, analysts will quickly be able to add in different options for submission.

    Analysts can add the following options when submitting indicators:

    1. Title of the submission
    2. Description
    3. Source the indicators came from
    4. Rating on indicators
    5. Confidence level associated with the indicators
    6. Any associated tags from within your TC organization.
    Keep Reading

    Related Resources

    Built By Polarity

    ThreatConnect Intel Search with Polarity

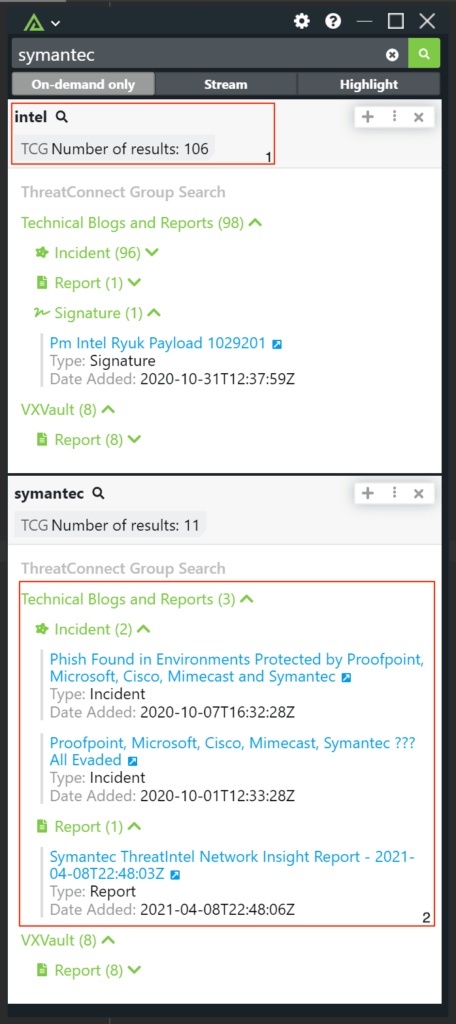
    The Polarity - ThreatConnect Intel Search integration allows Polarity to search Group titles in your instance of ThreatConnect.

    The integration works by caching up to 10,000 group objects per owner in memory. The integration will then search the title of these group objects and return any matches. The cached group objects are refreshed automatically every hour.

    Examples

    ThreatConnect Intel Search Data Overview

    • Summary Tags: When running a group intel search, analysts can quickly tell the number of associated results. Quickly understanding the profile of the term that was searched.
    • Blogs and Reports: When drilling into the details of the Intel Search integration, analysts can get more details on the blogs/reports/incidents and more. From there the analyst can pivot to ThreatConnect for more context.
    Keep Reading

    Related Resources

    Built By Polarity

    ThreatConnect CAL with Polarity

    The Polarity - CAL integration enables analysts to have intelligence they can trust, allowing them to have immediate community driven insights into over 2 billion indicators. Providing threat scores for analysts to quickly triage as well as insights into how often indicators are being seen. Empowering analysts to make quick decisions on how an indicator is effecting them and their environment.

    Examples

    ThreatConnect CAL Data Overview

    • Summary Tags: Analysts can quickly see the calculated CAL score when searching for an Indicator in ThreatConnect CAL before drilling in for more details.
    • Indicator ReputationCAL Score: CAL uses its massive data set and our analytics to help provide a baseline reputation score on a 0–1000 scale with ranges of Low, Medium, High, and Critical.CAL StatusMany CTI sources are prone to errors that create false positives. False positives can take the form of benign misclassifications, temporal sensitivity, automated or crowd-sourced misclassification, or context variations about an indicator. CAL Indicator Status helps reduce analyst fatigue by continuously classifying Indicators based on a wide variety of metadata related to their type, recency, feed redelivery, score, and engagement to determine if Indicators should be:
      • Active - This Indicator is considered interesting enough to be actively monitored/alerted/queried.
      • Inactive - This Indicator is considered too noisy or uninteresting to warrant alerting. The inactive status is leveraged for false positives or other Indicators not actively tracked in firewalls, sensors, SIEMs, etc.
      • Unassigned - The Indicator can not be assigned a status due to a lack of information or conflicting information about whether it is benign.
      Impact Factors - This section displays the key factors, if any, that impacted an Indicator’s CAL score and corresponding icons that Indicate how much each factor impacted the Indicator’s CAL score and whether it increased or decreased the score.
    • CAL Feed information: When available, CAL provides Indicator visibility in 52 active OSINT feeds, the time the Indicator was first and last seen, and the total number of reported feeds.
    • CAL Classifiers: CAL has 103 Classifiers designed to provide a clear, concise vocabulary for understanding salient data points about an Indicator. Classifiers are dynamic and may be added and removed from an Indicator as context changes.
    • Feed specific enrichment: When available, additional OSINT Feed enrichment information, including tags, malware families, file information such as SHA1, SHA256, MD5 file hash information, and more!
    • CAL Observations, Impressions, and False Positive reports: Analytics that are reported by instances of ThreatConnect and Polarity that have opted into CAL.
      • Observations of Indicators observed in an actual network potentially represent a greater risk.
      • Impressions of the number of times an Indicator is viewed, searched for, or looked up via ThreatConnect Playbooks.
      • False Positive reports rom ThreatConnect community members.
    • CAL Quad9 Observed Attempted Resolutions: This section shows the locations of computers that attempted to access suspicious domains captured by Quad9 infrastructure within the last 90 days.

    ThreatConnect CAL Data Overview - Known Good

    • Summary TagsAnalysts can quickly see the calculated CAL score when searching for an Indicator in ThreatConnect CAL before drilling in for more details.
    • Indicator ReputationCAL Score - CAL uses its massive data set and our analytics to help provide a baseline reputation score on a 0–1000 scale with ranges of Low, Medium, High, and Critical.CAL StatusMany CTI sources are prone to errors that create false positives. False positives can take the form of benign misclassifications, temporal sensitivity, automated or crowd-sourced misclassification, or context variations about an indicator. CAL Indicator Status helps reduce analyst fatigue by continuously classifying Indicators based on a wide variety of metadata related to their type, recency, feed redelivery, score, and engagement to determine if Indicators should be:
      • Active - This Indicator is considered interesting enough to be actively monitored/alerted/queried.
      • Inactive - This Indicator is considered too noisy or uninteresting to warrant alerting. The inactive status is leveraged for false positives or other Indicators not actively tracked in firewalls, sensors, SIEMs, etc.
      • Unassigned - The Indicator can not be assigned a status due to a lack of information or conflicting information about whether it is benign.
      Impact Factors - This section displays the key factors, if any, that impacted an Indicator’s CAL score and corresponding icons that Indicate how much each factor impacted the Indicator’s CAL score and whether it increased or decreased the score.
    • CAL Feed informationWhen available, CAL provides Indicator visibility in 52 active OSINT feeds, the time the Indicator was first and last seen, and the total number of reported feeds.
    • CAL ClassifiersCAL has 103 Classifiers designed to provide a clear, concise vocabulary for understanding salient data points about an Indicator. Classifiers are dynamic and may be added and removed from an Indicator as context changes.
    • Feed specific enrichmentWhen available, additional OSINT Feed enrichment information, including tags, malware families, file information such as SHA1, SHA256, MD5 file hash information, and more!
    • CAL Observations, Impressions, and False Positive reportsAnalytics that are reported by instances of ThreatConnect and Polarity that have opted into CAL.
      • Observations of Indicators observed in an actual network potentially represent a greater risk.
      • Impressions of the number of times an Indicator is viewed, searched for, or looked up via ThreatConnect Playbooks.
      • False Positive reports rom ThreatConnect community members.
    Keep Reading

    Built By Polarity

    Analyst Telemetry - Elasticsearch

    The Polarity - Analyst Telemetry (Elasticsearch) integration utilizes the built-in telemetry that Polarity provides, and is sent into Elasticsearch to provide a unique view into indicators. The integration allows analysts to see a search history of the indicator they are looking at, so they can see information on who else has seen the indicator, what sources have information on it and when, as well as when the indicator was first seen.

    Allowing analysts to have a unique insight into the indicator and how it effects their environment.

    Examples

    Telemetry Data Overview - Summary

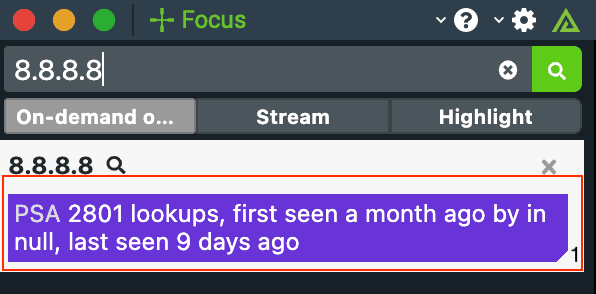
    • Summary Tag: When analysts first use the telemetry integrations, they will be presented with a quick overview to determine how many times the indicator searched has been seen, by and whom, and when it was last seen. Enabling analysts to have quick insights into the indicator to see how it has been seen across your org, and if other analysts are also currently looking at the indicator.

    Telemetry Data Overview - Searches Over Time

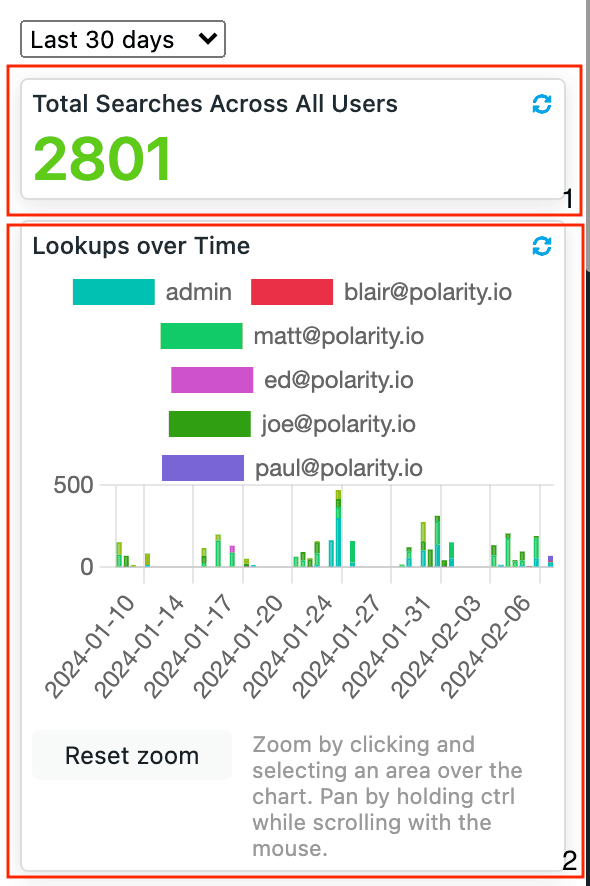
    • Total Searches: When an analyst drills into the telemetry integration they will quickly be able to see the total number of lookups across your team. Enabling analysts to have a good understanding of how common this indicator is seen in their environment.
    • Lookups over Time: Analysts can also see over time how the indicator has been viewed and by whom. To see a timeline on the indicator in your environment. Leading to better overall analysis across the team.

    Telemetry Data Overview - Integration Results

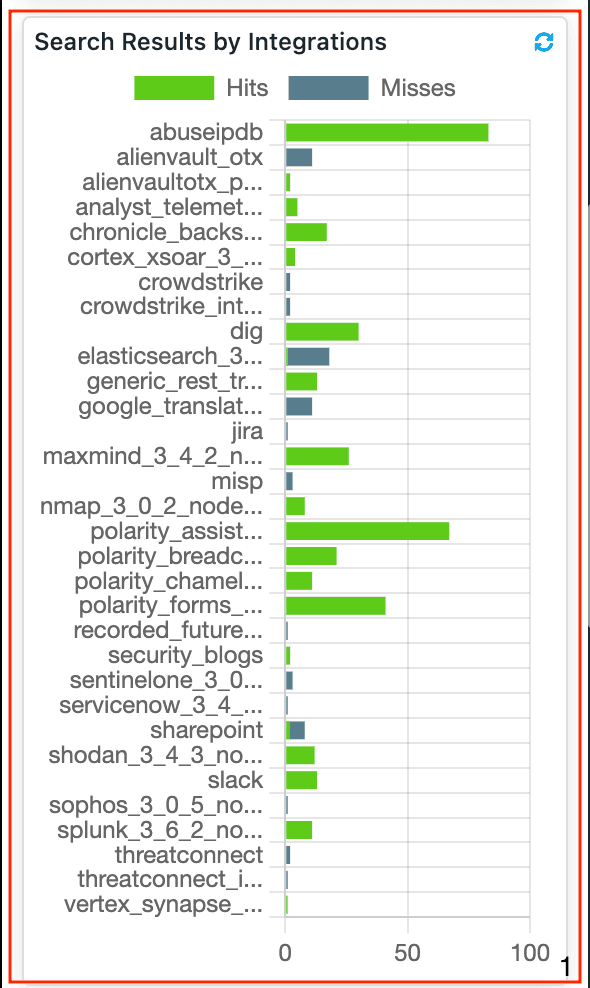
    • Integration Results: When drilled into the integration analysts can also quickly see how integrations and data sets have viewed the indicator to get a quick analysis on how integrations have data on indicators in question.

    Telemetry Data Overview - Summaries

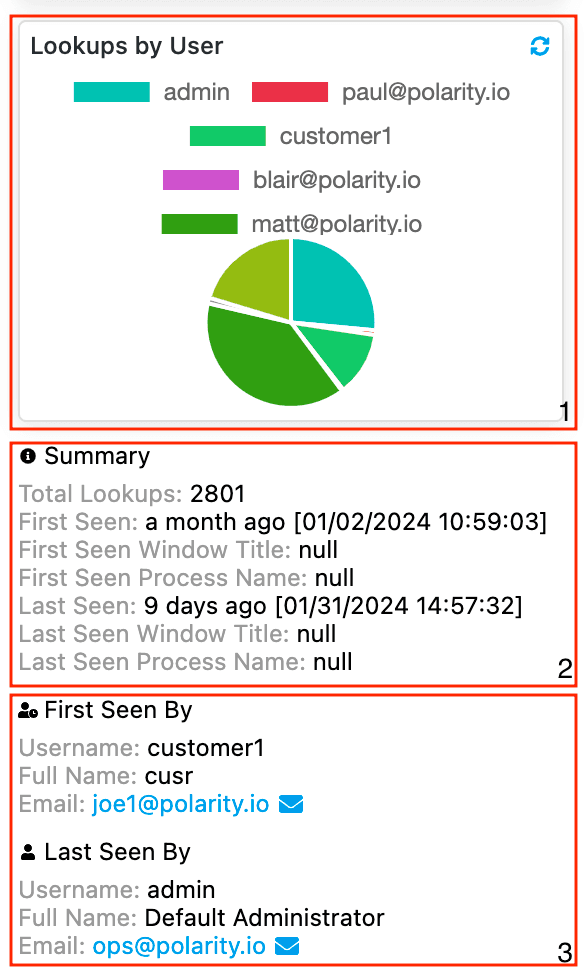
    • Lookups by User: Analysts can quickly see who is viewing the indicator to get an understanding of who they might contact if they have questions on the indicator as well as to see who might be doing more analysis on it.
    • Summary: Analysts also get a quick summary of the integration to see where it is being seen, when and by whom. To have a better complete picture.
    • Seen By: Finally analysts can see when and by whom the indicator was first seen by to try and gather context on where and how it was seen to see if it requires further analysis. Allowing folks to have a complete picture and catch potential breaches faster.
    Keep Reading

    Related Resources

    Built By Polarity

    Analyst Telemetry - Splunk

    The Polarity - Analyst Telemetry (Splunk) integration utilizes the built-in telemetry that Polarity provides and is sent into Splunk to provide a unique view into indicators. The integration allows analysts to see a search history of the indicator they are looking at, so they can see information on who else has seen the indicator, what sources have information on it and when, as well as when the indicator was first seen.

    Allowing analysts to have a unique insight into the indicator and how it effects their environment.

    Examples

    Telemetry Data Overview - Summary

    • Summary Tag: When analysts first use the telemetry integrations, they will be presented with a quick overview to determine how many times the indicator searched has been seen, by and whom and when it was last seen. Enabling analysts to have quick insights into the indicator to see how it has been seen across your org and if other analysts are also currently looking at the indicator.

    Telemetry Data Overview - Searches Over Time

    • Total Searches: When an analyst drills into the telemetry integration they will quickly be able to see the total number of lookups across your team. Enabling analysts to have a good understanding on how common this indicator is seen in their environment.
    • Lookups over Time: Analysts can also see over time how the indicator has been viewed and by whom. To see a timeline on the indicator in your environment. Leading to better overall analysis across the team.

    Telemetry Data Overview - Integration Results

    • Integration Results: When drilled into the integration analysts can also quickly see how integrations and data sets have viewed the indicator to get a quick anlaysis on how integrations have data on indicators in question.

    Telemetry Data Overview - Summaries

    • Lookups by User: Analysts can quickly see who is viewing the indicator to get an understanding of who they might contact if they have questions on the indicator as well as to see who might be doing more analysis on it.
    • Summary: Analysts also get a quick summary of the integration to see where it is being seen, when and by whom. To have a better complete picture.
    • Seen By: Finally analysts can see when and by whom the indicator was first seen by to try and gather context on where and how it was seen to see if it requires further analysis. Allowing folks to have a complete picture and catch potential breaches faster.
    Keep Reading

    Related Resources

    Built By Polarity

    Polarity Assistant
    The Polarity AI Assistant integration enables users to summarize the results produced by other integrations and optionally submit form based feedback/requests on the summary's quality and accuracy via email. Enabling analysts to have a quick summary of what they are looking at then take that data and add it to reports!

    The integration currently supports using the Azure OpenAI GPT-4-32k or OpenAI GPT-4-turbo model to perform the summarization.

    Examples

    Polarity Assistant Initial View

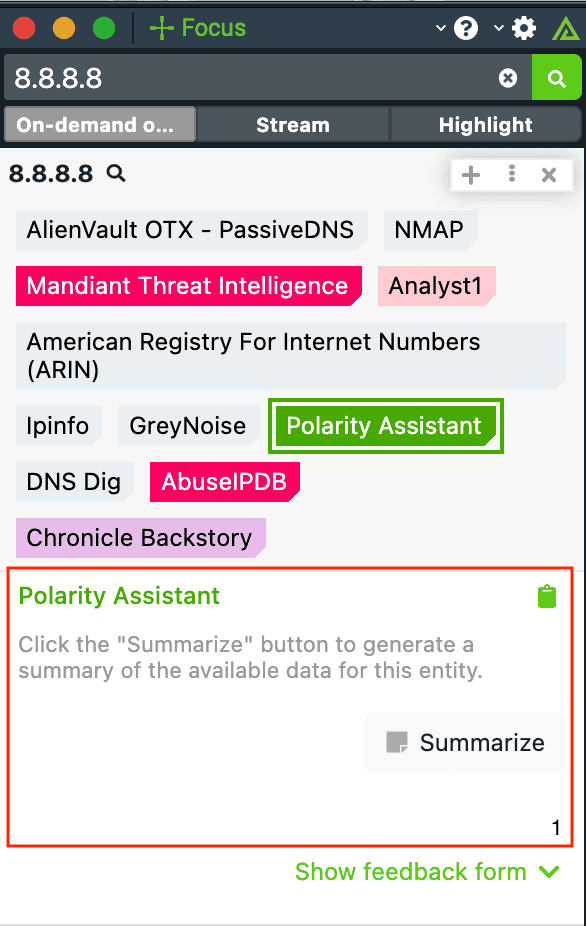
    • Initial Integration View: When an analyst runs a search and has Polarity Assistant enabled the integration will not have any information by deafult.

    To have the Polarity Assistant integration summarize the data in the overlay window, just click on the "Summarize" button.

    Polarity Assistant Main View

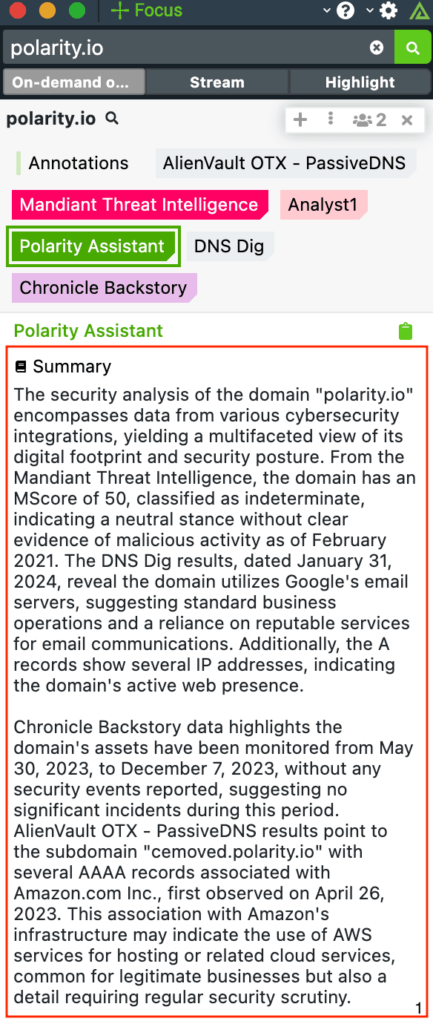
    • Summarized Data: After clicking on the Summarize button, the integration will start to summarize the information surrounding the indicator. The results will start to stream back into the overlay window as the AI assistant is summarizing it.

    Polarity Assistant Recap View

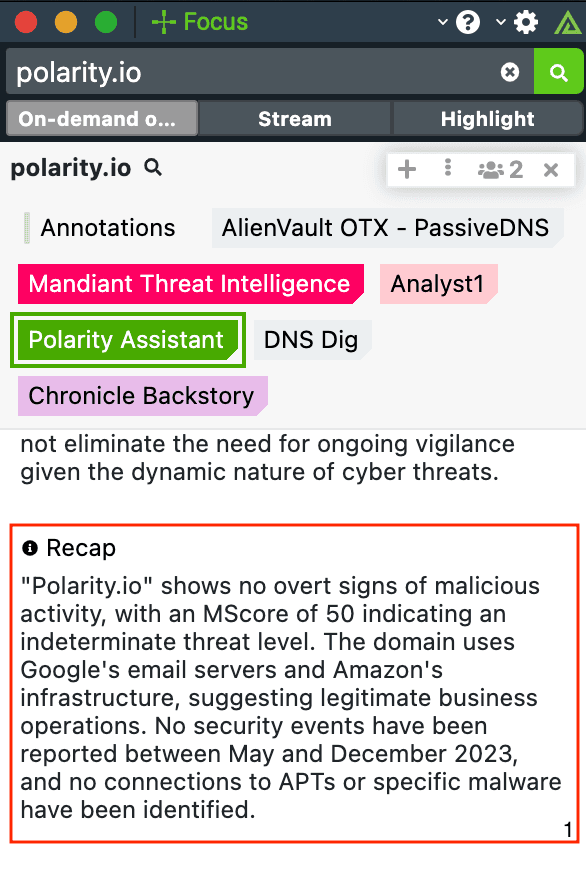
    • Recap: After the summary is completed, Polarity Assistant will then summarize the summary into a recap so analysts can quickly get an understanding of the indicator.

    Polarity Assistant Feedback View

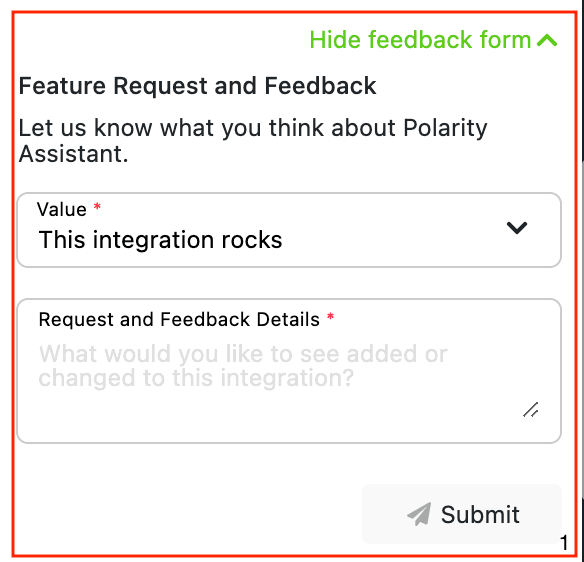
    • Feedback Form: As a part of the Polarity Assistant integration, analysts can easily send feedback on how the integration is performing. Just click on the "Show Feedback Form" button and fill out the associated information!

    This helps Polarity better tune and adjust the prompts for the integration.

    Keep Reading

    Related Resources

    Built By Polarity

    Exploit Finder

    The Polarity - Exploit Finder integration utilizes the Google Custom Search Engine to search different sites for known exploits about CVEs or different code.

    Please check out the reference links for all the sites the integration utilizes.

    For more on Google Custom Search Engines please see: https://developers.google.com/custom-search/v1/overview

    Examples

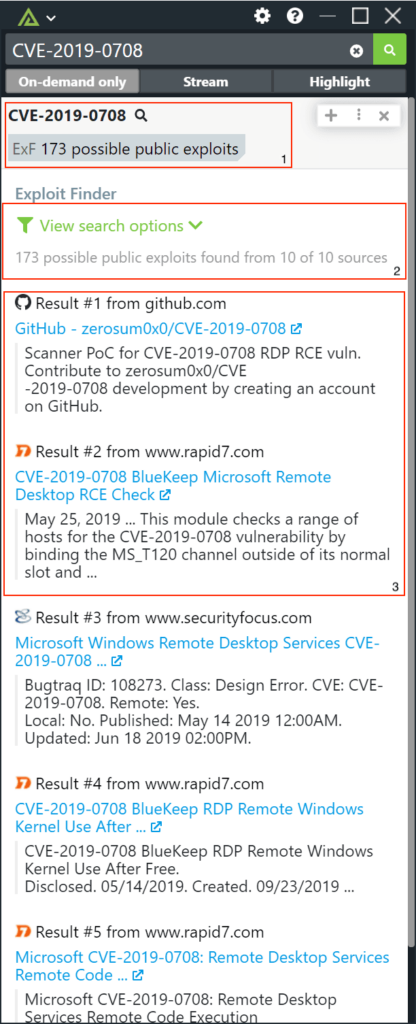
    Exploit Finder Data Overview

    • Summary Tags: Total number of exploits available for the indicator that was looked up.
    • Search Options: Narrow the sources that were searched to better tailor the experience.
    • Source Results: Links to the different exploits that are grouped by source. Just click on the link to link out to the Exploit to get more context.
    Keep Reading

    Related Resources

    Built By Polarity

    Regex Cheat Sheet with Polarity

    The Polarity Regex Cheat Sheet integration looks up regex characters to let users know what those characters for and notes about them.

    Examples

    Regex Cheat Sheet Data Overview

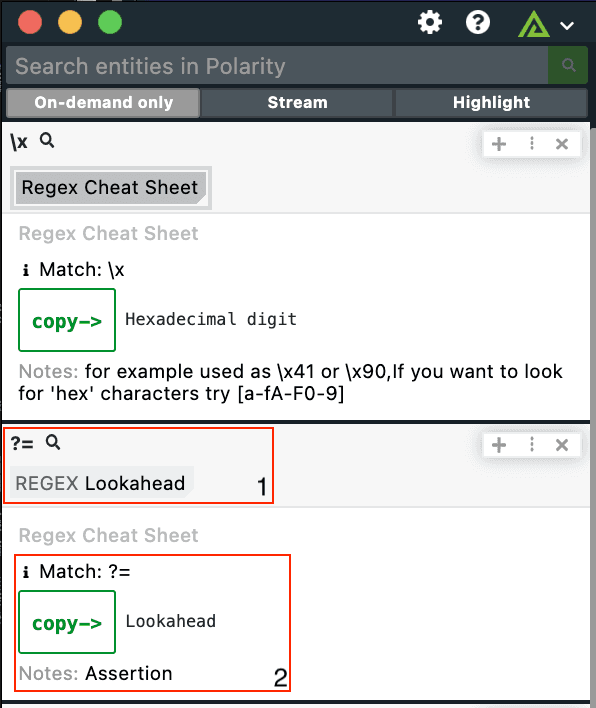
    • Summary Tag: When looking up information with the Regex Cheat Sheet integration, analysts can quickly tell what part of a Regex does what.
    • Regex Details: When drilling into the details of the integration, analysts can quickly see any additional notes and then copy out the part of the regex if they are trying to use it.
    Keep Reading

    Related Resources

    Built By Polarity

    Epoch Time with Polarity

    The Polarity - Epoch Time integration enables analysts to quickly convert unix timestamps otherwise known as Epoch Time into a more human readable timestamp. Enabling analysts to have a better understanding of the time when something occurred.

    Examples

    Epoch Time Data Overview

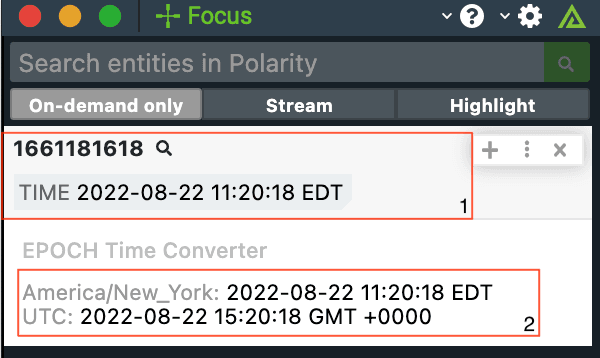
    • Summary Tags: When an analyst comes across epoch time they can quickly convert that into a local time to have a better understanding of when that timestamp takes place.
    • Time Details: When drilling into the details, analysts can also get information on the GMT time and more details on the timezone selected.
    Keep Reading

    Related Resources

    Built By Polarity

    Looking for an
    integration not shown?