Elastic, the Search AI Company, enables everyone to securely harness search powered AI to find the answers they need in real-time using all their data, at scale. Elastic’s solutions for search, observability and security are built on the Elastic Search AI Platform, the development platform used by thousands of companies, including more than 50% of the Fortune 500.
The ThreatConnect integration with Elastic Security brings ThreatConnect Indicators and their Attributes and Associations into Elastic Security. To accomplish this, the integration uses the Filebeat module to pull data from ThreatConnect via the ThreatConnect API and store the data in Elastic Security as log files. The ThreatConnect log files can then be parsed and visualized using Kibana Discover, a built-in Kibana dashboard, and the Indicators page in Elastic Security. Detection rules that activate on the threat intelligence data ingested by Elastic Security can be defined too. The integration is highly customizable via specific configurations and its ability to use TQL.
The integration is available directly from the Elastic Stack via the Integrations section under Stack Management.
The Elastic Security Playbook and Service Apps allow TI Ops users to interface with the Elastic Security API's alert, case, and detection endpoints. The Service App enables retrieving detection alerts on a set schedule.
The following actions are available for threat intelligence management:
Get Alert - Retrieve an alert by its alert ID.
Update Alert Status - Update an existing alert.
Create Detection Rule - Create a new detection rule. Rules run periodically and search for source events or machine learning job anomaly scores that meet their criteria. When a rule’s criteria are met, a detection alert is created.
Update Detection Rule - Update an existing detection rule's fields.
Delete Detection Rule - Delete a detection rule.
Get Detection Rule - Retrieve a detection rule by its ID.
Add Case Comment - Adds a comment to an existing case.
Create Case - Create a new case.
List Cases - Return a list of all cases.
This app can be found in the ThreatConnect App Catalog under the name: ElasticSecurity
With the Elastisearch Service App integration, TI Ops Platform users can execute a search query and get back results that match the query. The app retrieves the executed search query on a set schedule. This integration supports Lucene, Query DSL, and EQL languages.
The following actions are available:
Query Index
This app can be found in the ThreatConnect App Catalog under the name: Elasticsearch
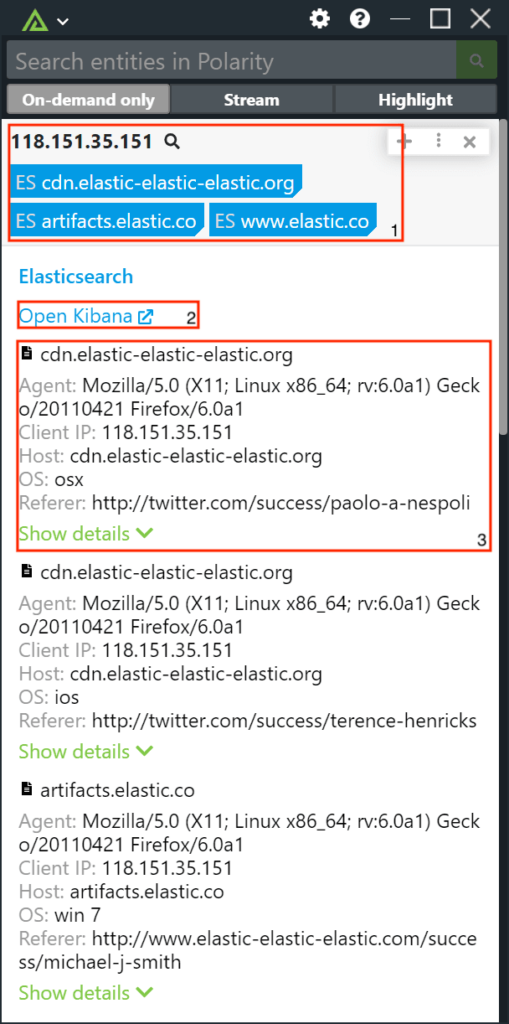
The Polarity - Elasticsearch integration provides security analysts with real-time insights into any data contained within indexes in Elasticsearch. Enabling analysts to quickly search multiple indexes in Elastichsearch allowing them to have a complete understanding of what is happening with an indicator.
Examples
Elasticsearch Data Overview
Summary Tags: When running a search in Elasticsearch analysts will quickly be presented with the information that matters most to the index they are searching. The information here is setup by an admin during the initial setup of the integration.
Elasticsearch Link: When drilling into the details of the Elasticsearch integration analysts will quickly be able to pivot out to their Elasticsearch instance to view the search results in more detail.
Detailed Data: While drilled into the integration analysts will also see the additional context set forward by their admin so they can make quick decisions about the indicator searched.
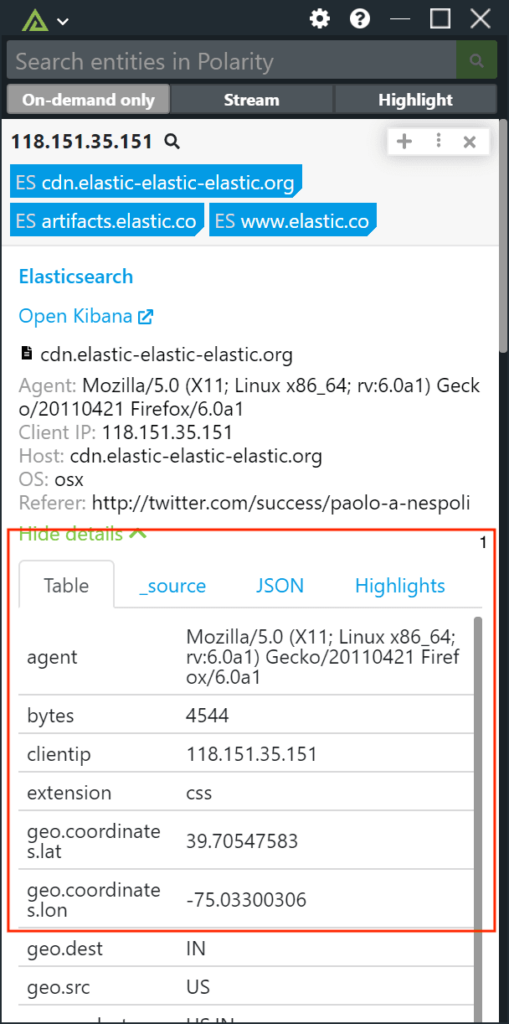
Full Details: When drilling into the details of the indicator search analysts can click in and see all the relevant data with the indicator and not just the detail information set forward by the Elasticsearch admins. Analysts can view this data in json, table, source and highlight views.
The summary and details information is setup by your Elasticsearch integration admins. If there is additional context needed please reach out them.