Posted
Modern businesses undergo changes every day that introduce cyber risk and obfuscate residual risks. This is especially true as companies digitize their operations and continue to have a healthy appetite for merger and acquisitions (M&A) activity.
You might have a good idea of what risks your current applications present, but can you pinpoint the residual risk the company takes on as you work toward fulfilling your digital initiatives? Most times, this is not a foremost concern on a business leader’s mind. It should be.
Cyber risk quantification often gets branded as a long, drawn-out process involving consulting firms, spreadsheets, manual processes, and complex calculations for comparison. The good news is it doesn’t have to be that way. Cyber risk quantification can be automated, objective, and quick to produce actionable results.
Most importantly, it allows the complex calculations that happen behind the scenes to be displayed in a single-view format that everyone can understand.
About 40 percent of the boards of directors will have a dedicated cybersecurity committee overseen by a qualified board member by 2025, up from less than 10% today – Gartner 2020 Board of Directors Survey.
Now that executives are increasingly being held accountable by boards of directors, shareholders, and customers for security failures that lead to data breaches, they are starting to ask tough questions and want solid answers from the chief information security officer (CISO). They need to find a way to:
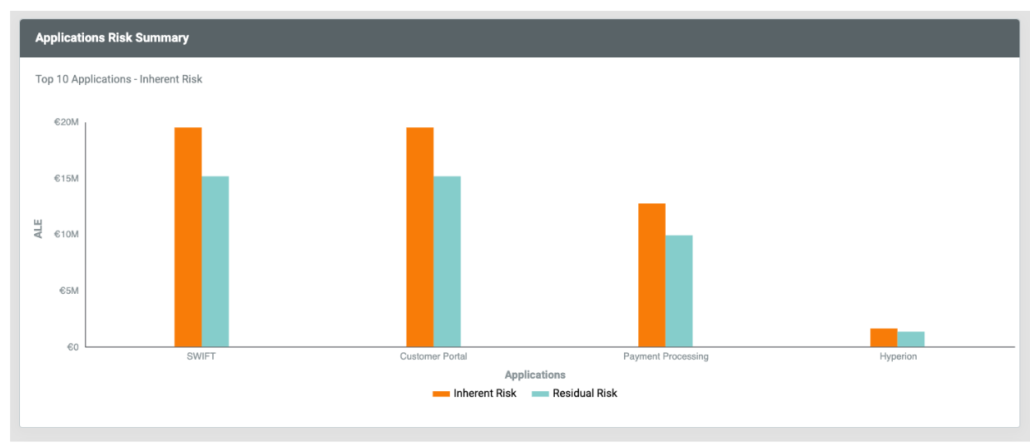
- Compare the inherent and residual risks for all applications
- Understand which applications have the highest inherent risk
- Demonstrate what makes up the inherent risk including:
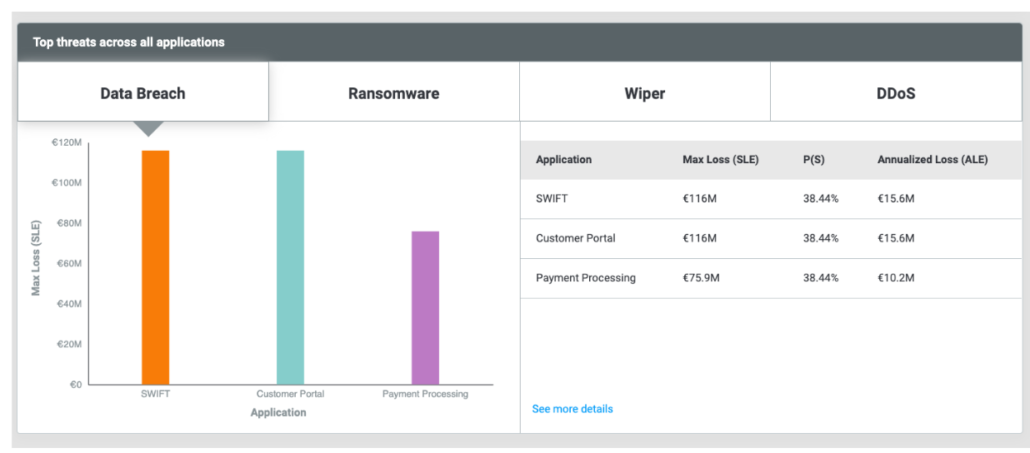
- Attacks that cause the most damage
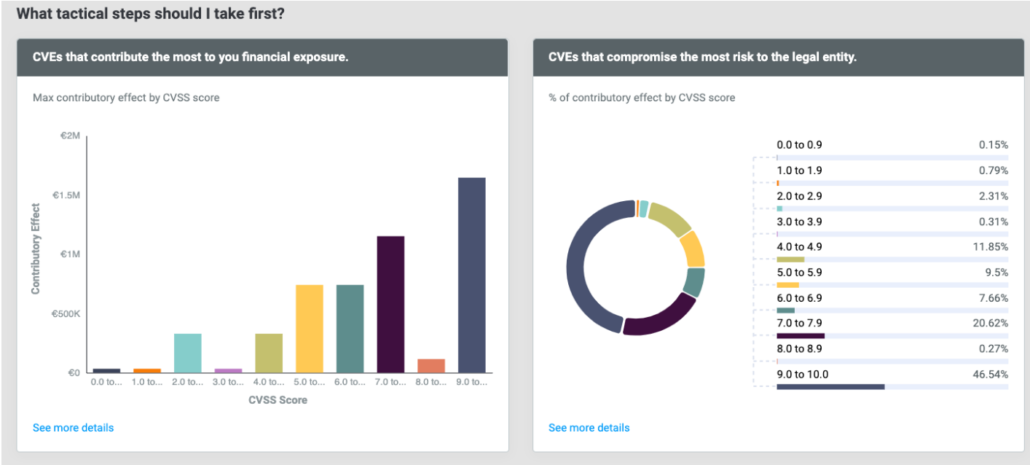
- Control(s) that are the most impactful to the inherent and residual risk of the applications
With ThreatConnect Risk Quantifier (RQ) 5.1, you’re able to compare and contrast investments and initiatives to see how they reduce risk. You can then show both the current inherent risk and the residual risk of taking on new business, such as launching a new digital service or M&A activity.
With this knowledge, you can easily point out the residual cyber risk in new digital programs as well as the inherent risk of existing applications. This helps you justify spend and security investments (purchases, training, hiring) and understand what the risks/impacts of doing one vs. another are.
In RQ 5.1, we’ve made vast improvements in scalability and analytics and are introducing a streamlined dashboard that brings more to the top layer for easy reference. Let’s take a look at these new capabilities below.
Inherent and Residual Risk
RQ now makes it easy to understand the reduction of residual risk when new controls or applications are deployed. Get automated updates of inherent and residual risk so you can see before and after scenarios without adding manual processes of complex calculations for comparison. And this isn’t just for one set of applications. With RQ, you can measure residual risk across multiple application portfolios. This is extremely important for organizations with multiple business units or for managed services providers who are managing multiple clients.

Compare, Rank, and Prioritize Top Risks at Scale
A new, streamlined dashboard provides a front and center display of top cybersecurity threats affecting your applications in terms of the quantified risk they introduce. You can see this information for an individual company or across multiple groups which, as mentioned above, is extremely useful when your organization has multiple subsidiaries and business units, or for MSSPs.

Reporting and Communication Improvements
Improved analytics enable you to have conversations that highlight your current top strategic recommendations and how they are reducing residual risk as the company continues to expand through new digital services and applications. It helps stakeholders across the organization understand how long-term and short-term recommendations can reduce residual risk in strategic and tactical ways.

