Posted
The ThreatConnect Platform is optimized for providing organizations the ability to create a custom dashboard for pulling together real-time, topical threat intelligence into a single view.
The current situation in Ukraine has led organizations to ask – “how should I operationalize our intelligence related to this situation so we can have a better perspective on threat actors and groups, campaigns and other threat-related activities (like opportunistic phishing attacks and scams) associated with the Ukraine / Russia conflict?”
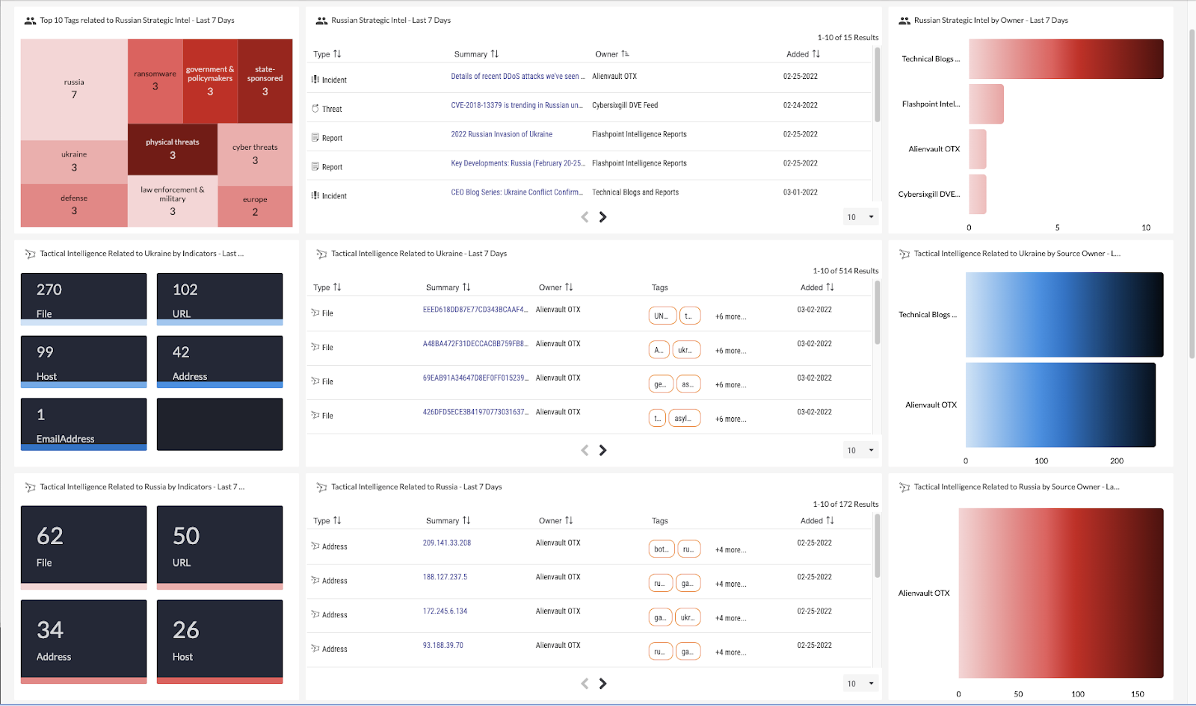
ThreatConnect makes it very easy to create custom dashboards that display the threat intelligence information you need. This example dashboard was created in minutes and provides a head-up-display type of real-time view on any threat intelligence that is associated with the conflict in Ukraine, as well as threat actors, campaigns, and indicators associated with Russia.
For example, any intelligence tagged to Russia or Ukraine can be brought into a heat/tree map and table, along with bar graphs showing the volume of intel per source. This will highlight threat intelligence specifically related to these tags, such as Alert (AA22-057A) from CISA alerting on destructive malware (WhisperGate and HermeticWiper) being targeted at Ukrainian organizations.

Taking this further, cards can be created that leverage ThreatConnect’s Collective Analytics Layer (CAL) and ThreatAssess scoring to show related indicators with the highest score and threat rating, allowing you to prioritize these indicators for sharing with your security team and integrated threat detection tools, like EDR, XDR, SWG, and firewalls. The image below shows the kind of information that can be aggregated and then used as part of your operational activities.

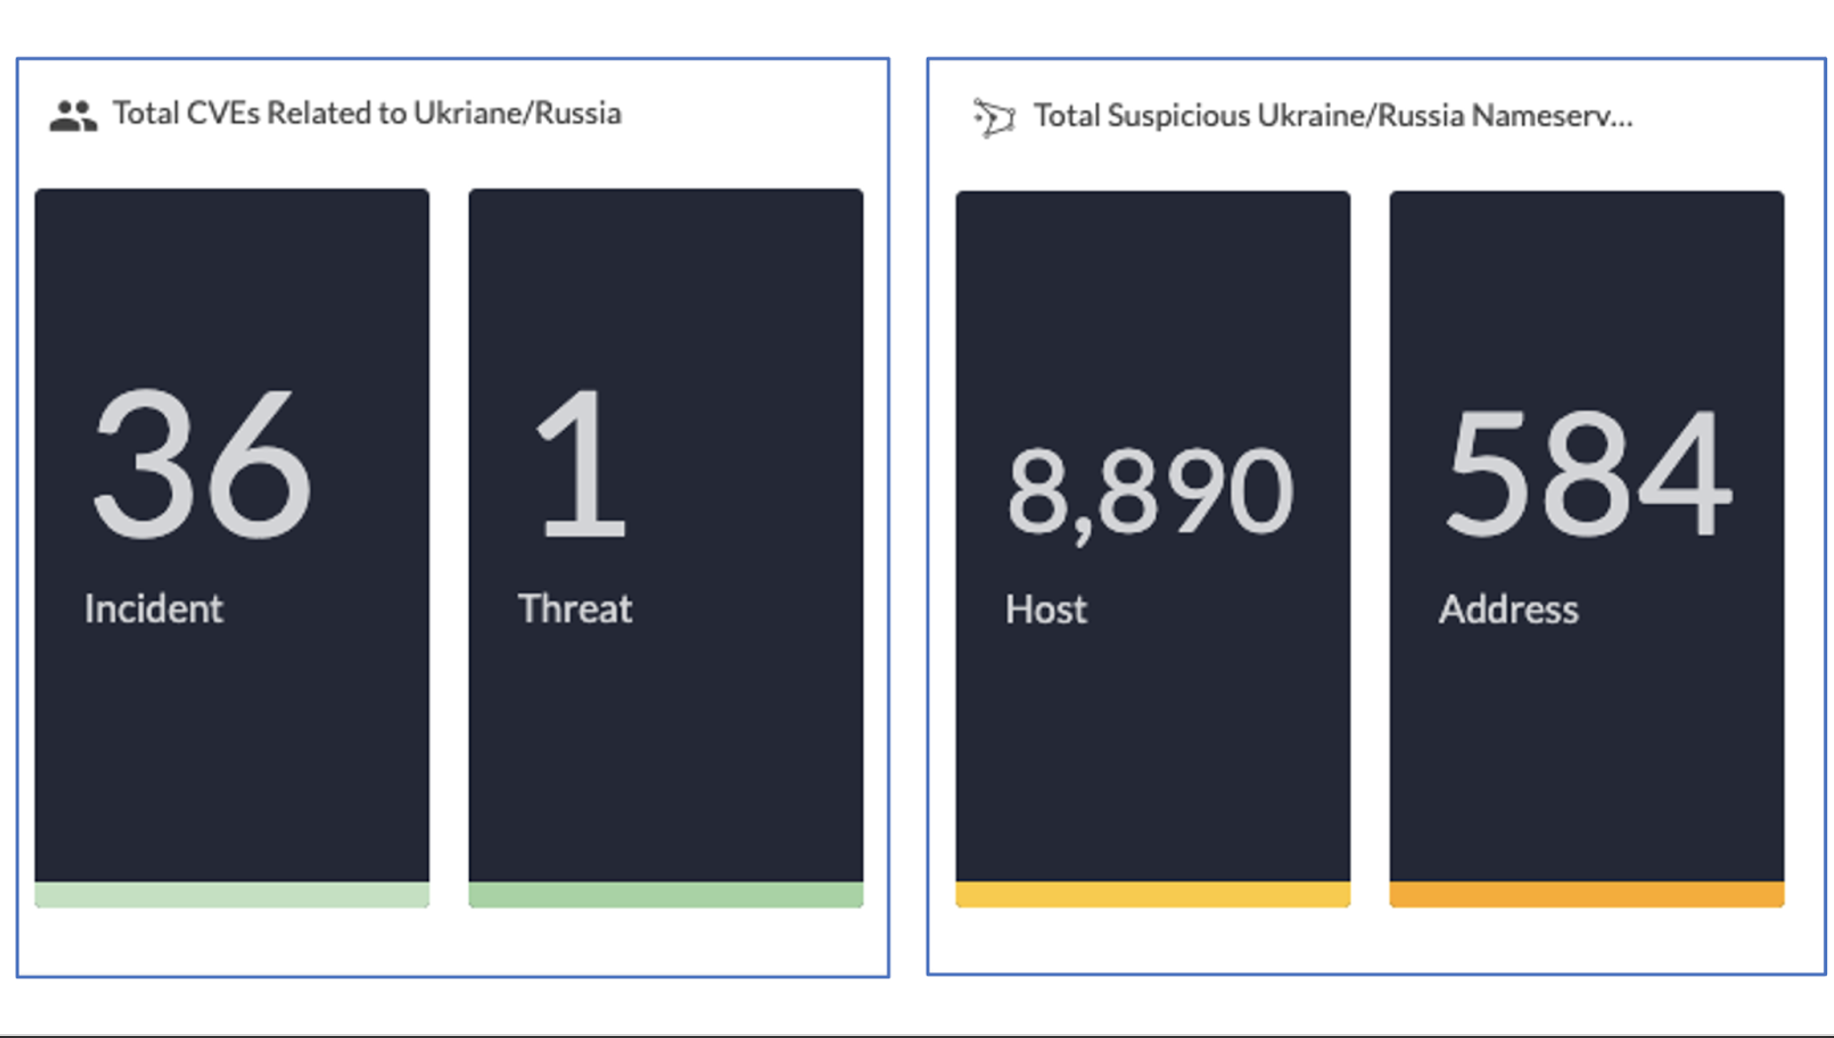
You can even create cards that aggregate CVEs and newly registered domains (NRDs) related to the conflict.
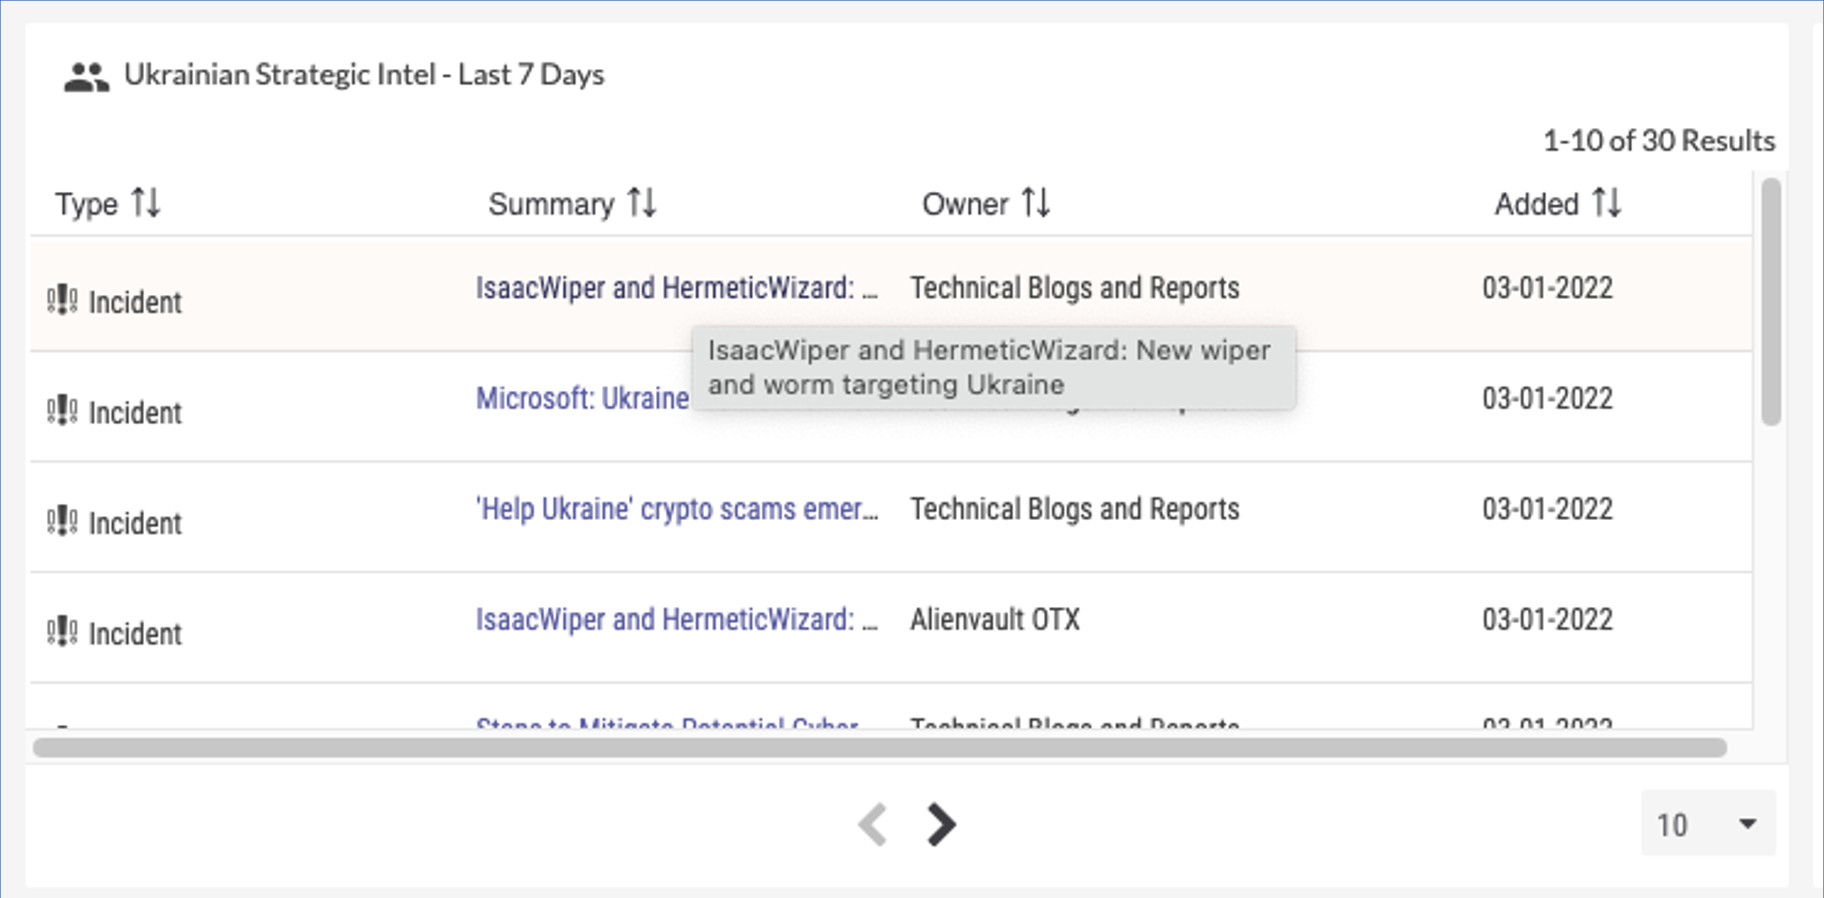
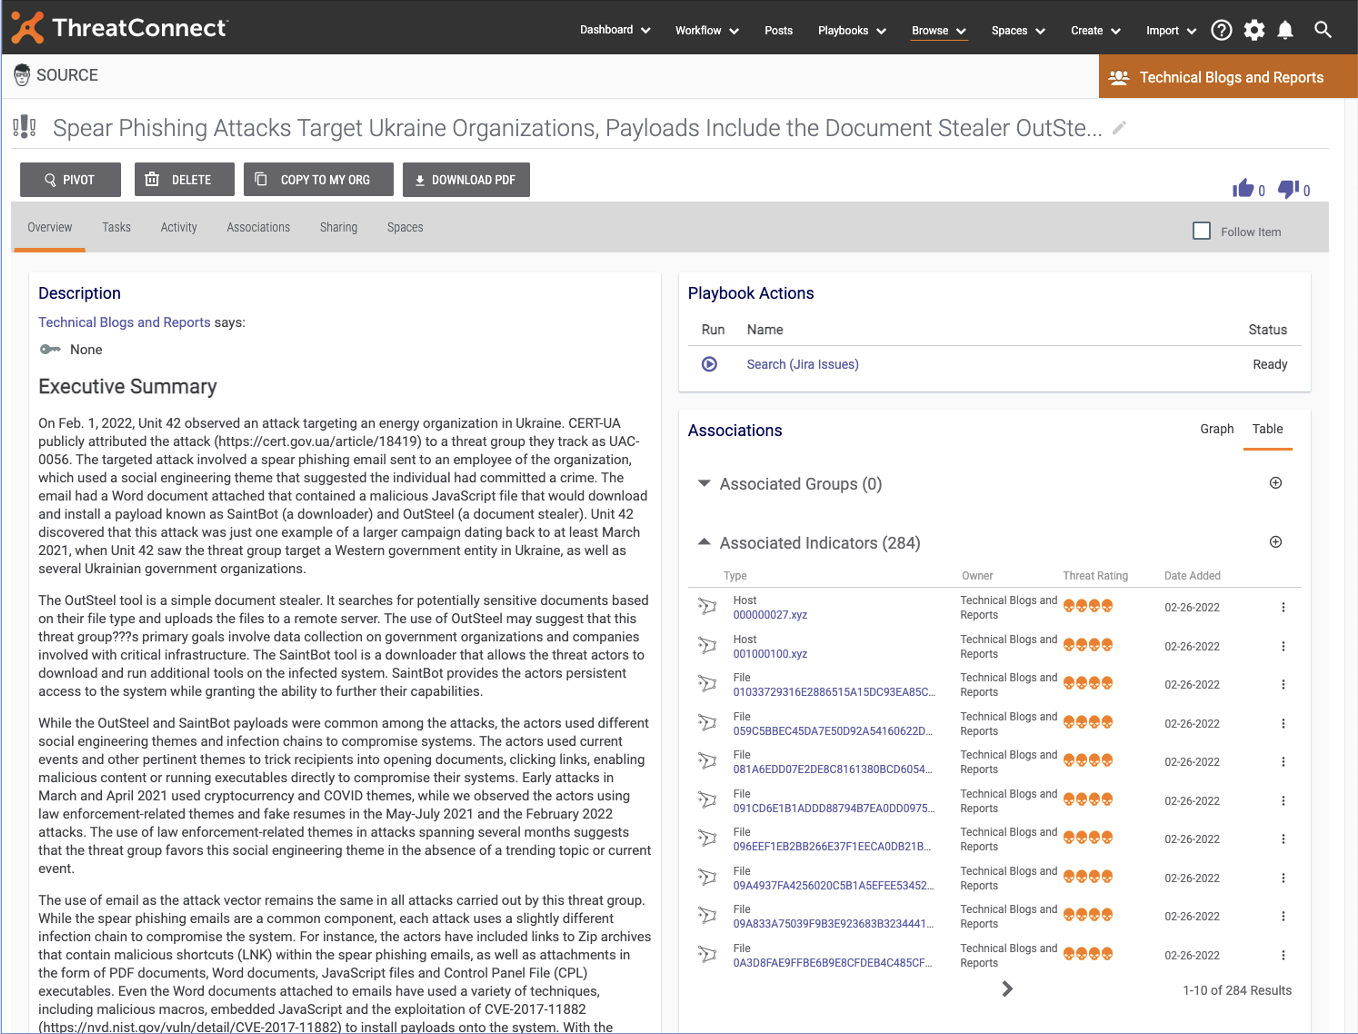
The power of ThreatConnect’s dashboards allows you to click into an element and quickly drill down into the information in a card rather than having to go click through a bunch of menus to get to this information. In the example below, clicking on the first Incident Summary takes you to the Intel Source page with all the rich details.


So how do you get started if you want to create your own dashboard bringing together the intelligence you have in ThreatConnect? If you’ve never created a custom dashboard in ThreatConnect or need a fresher, start with this tutorial.
We’ve provided a guide that includes two sample dashboards – compact and detailed – with instructions. You can download that guide here.
If you need further assistance, please reach out to the ThreatConnect Customer Service team and they will be happy to help you build out a dashboard.
Authored by the Customer Success, Product Marketing, and Solution Engineering teams.
