Posted
We all know the saying that, “a picture is worth a thousand words.” It is a fact that people derive meaning faster from imagery and graphics. At our core, humans are visual. Imagery can convey thoughts much faster and more efficiently than just words. Consider an example where you need to describe the shape of New York State, but you must use words and sentences to describe it accurately. How long would that take? Consider then, instead, just looking at an image of New York State. Of course, you will have an almost instant understanding of the data.
In the Security Operations Center (SOC), we always feel the “need for speed.” We know intuitively that reducing the time to maximize insight on any potential threat and similarly maximizing the speed and quality of collaboration with our team will reduce risk.
Change the Dynamics of the Playing Field to Gain Advantage
Visualization is a game changer. ThreatConnect’s Threat Graph visualization changes the dynamics of the playing field within the SOC. CTI analysts, SOC analysts, threat hunters, and incident responders can more quickly explore, pivot, and maximize insights into intelligence and data to get a comprehensive picture of threats to the organization. Threat Graph allows a faster and more complete understanding of any associations and relationships between potential indicators of compromise, threat groups, and other critical information.
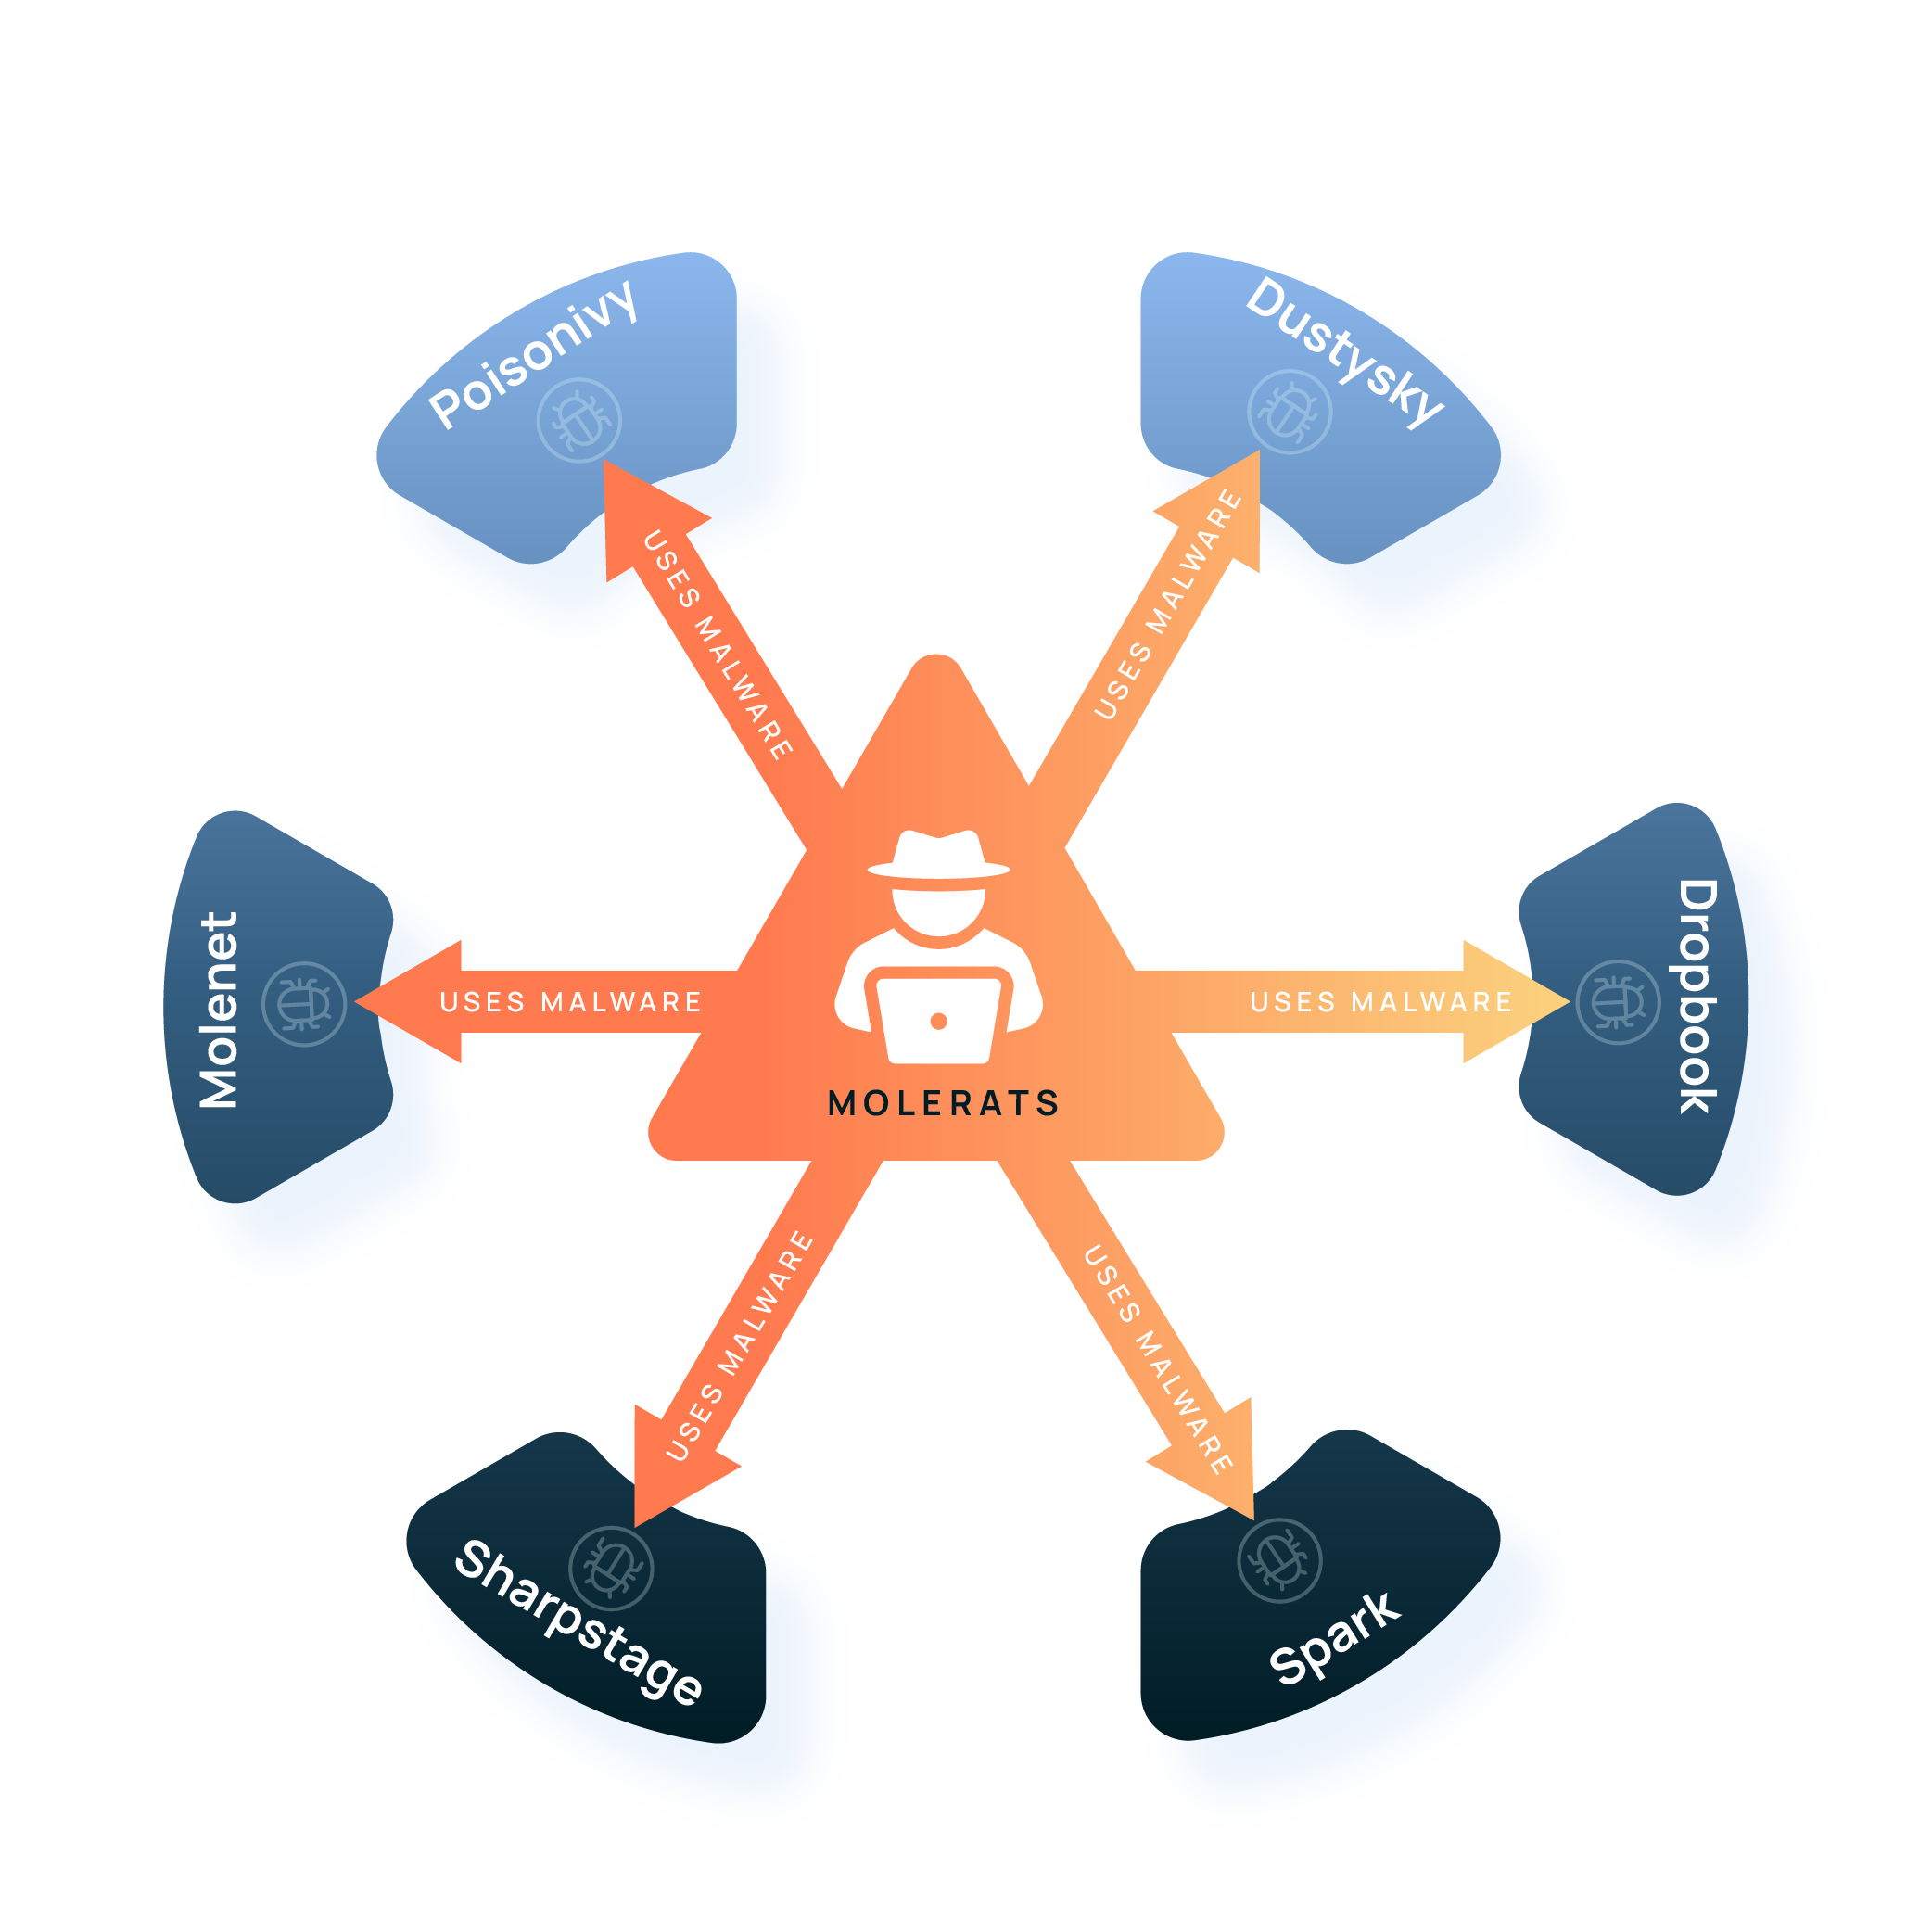
Threat Graph initially brought a powerful ability to users to pivot among the data in ThreatConnect’s Collective Analytics Layer (CAL) to more rapidly understand relationships that exist with unique IOCs like DNS details, host data, WHOIS registration, subdomains, and more. Today, Threat Graph allows you to pivot between Groups and Indicators within their ThreatConnect dataset as well as in the CAL dataset to perform link analysis. Analysts can now visually explore the associations between Intrusion Sets, MITRE ATT&CK techniques, threat actor groups, and the tools that they use.
The speed at which visualization identifies and enables actionable data substantially changes and improves the dynamics of activity within the SOC. Threat Graph’s powerful visualization helps move the initiative back to the defenders and enables defensive teams to “get inside” of the OODA loop and outpace their attackers.
The Threat Connect Platform
Threat Graph is an important part of the ThreatConnect Platform. The ThreatConnect Platform leverages risk insights and automation to help focus resources on the organization’s top priorities. The ThreatConnect Platform operationalizes threat intelligence and knowledge to drive every decision and action faster to maximize impact with increased effectiveness, efficiency, better decision-making, and strategic collaboration.
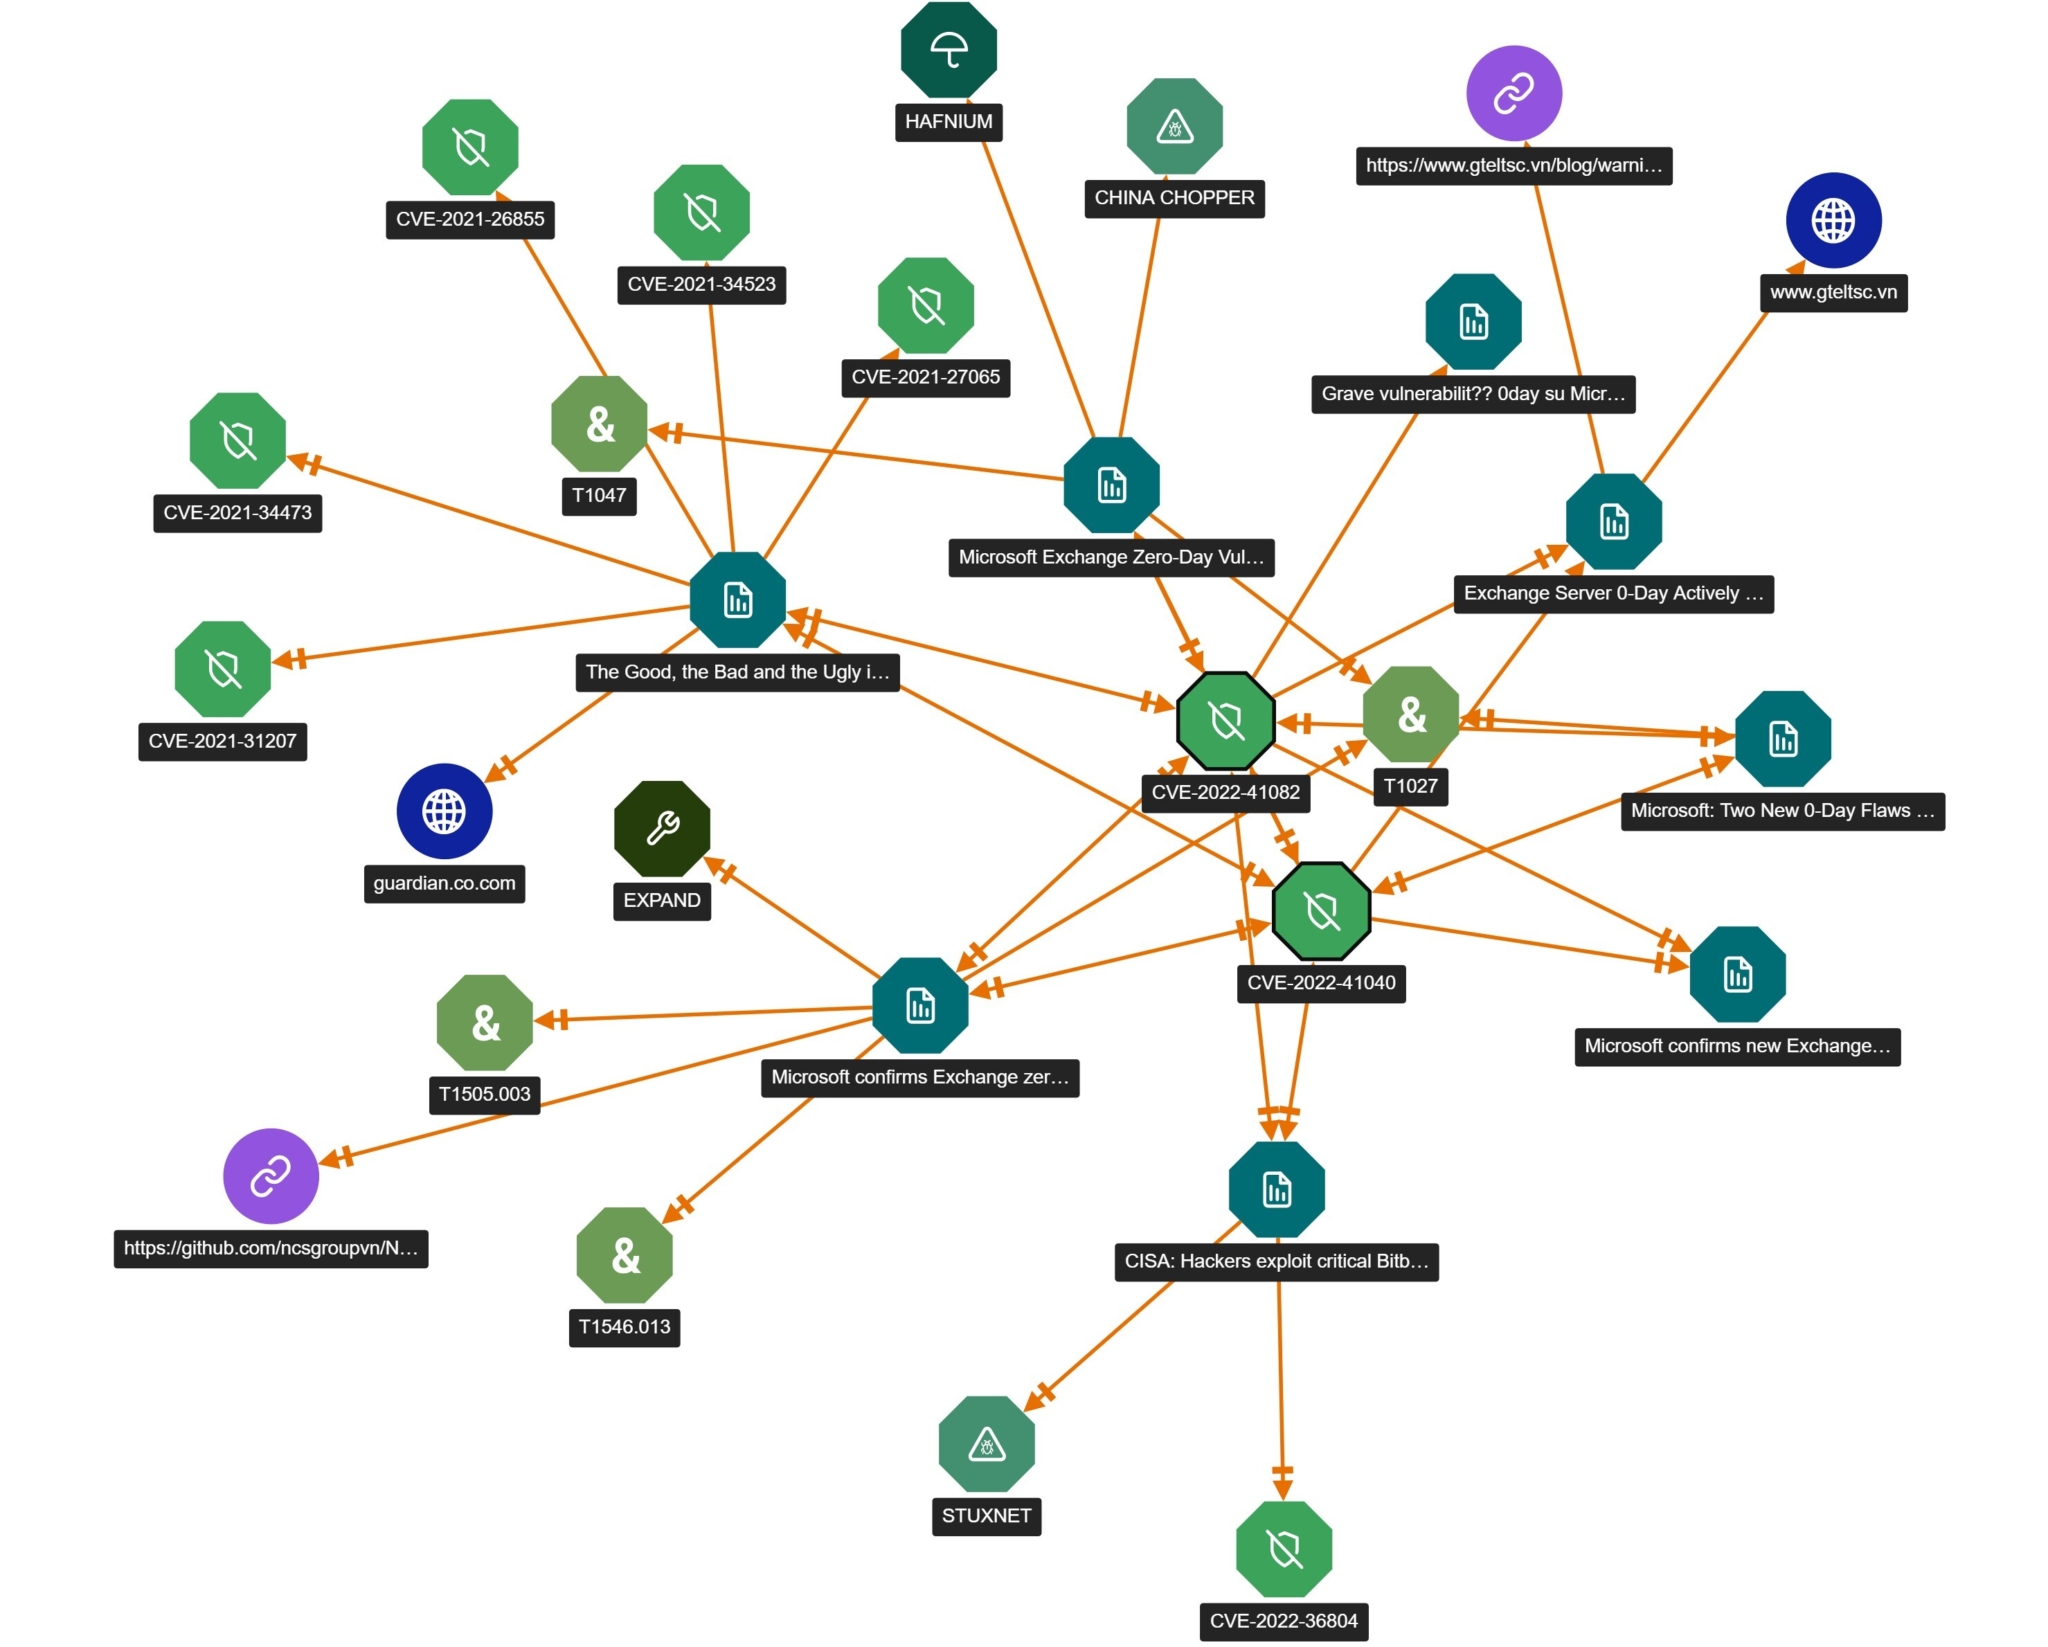
With ThreatConnect, your organization will move from reactive to proactive engagement. Your team will better leverage risk insights and more effectively use threat intelligence and knowledge to drive better decisions and more effective action. See below an example of Threat Graph in action with a recent vulnerability – ProxyNotShell.

Threat Graph Visualization – ProxyNotShell
Leverage the Power of ThreatGraph
Maximize insight, increase efficiency, and improve the overall depth, quality, and speed of team collaboration by leveraging the power of ThreatGraph. To learn more, please take a look at the ThreatConnect Platform. Reach out to us, and we’ll be pleased to share a customized demo of the ThreatConnect Platform.

